This article helps you find out why an event you are sending is not appearing in NVECTA, and where to look at each stage. Work through the checks in order, because each one rules out a layer between the SDK on the device and the event landing on a user profile.
Before you troubleshoot, kindly validate first. Integration Code, Event, and User Validation walks through Live Stats, Event Logs, Insights and User One View to establish whether the event is arriving at all. Run that pass first: if it shows the event landing correctly, there is nothing here to fix, and if it does not, it tells you which of the checks below to start with.
SDK initialised? Your website or app build | → | No Verify the integration and initialisation Part 1 |
Brand ID and credentials correct? Settings → Store Integration | → | No Update the configuration, and confirm the environment Part 2 |
Event request sent? Browser or device, then Analytics → Live Stats | → | No Check that the event call runs Part 3 |
Console configuration correct? Settings → Events, Organization → Billing | → | No Enable tracking or the event, or raise the limit Part 4 |
Error logs clear? Settings → Error Logs | → | Errors Resolve the issue named in the log Part 5 |
Segments → User One View · Part 6 | → | ✓ Found The integration is working end to end ↗ Not found Escalate with the SDK logs, event name, Brand ID, nv_uid and test time |
Where to check
Pick the surface that matches the question you are asking. Configuration questions belong in Settings, volume questions in Analytics, and identity questions in Segments.
Events (configuration, status and schema)
Where: Settings → Events
Shows whether tracking is on, whether the event exists, whether it is Active, and which attributes it accepts. It does not tell you whether one specific hit arrived.
Live Stats, Insights and User One View (has the event arrived?)
Where: Analytics → Live Stats, Analytics → Insights and Segments → User One View
These are the validation surfaces: Live Stats for the last 30 minutes, Insights for volume and trends over a longer period, and User One View for a single person's profile and timeline. How to read each one is covered in Integration Code, Event, and User Validation.
Error Logs (refused hits and the reason)
Where: Settings → Error Logs
Lists the problems hit while recording events. This is what tells a refused request apart from one that never arrived.
Part 1 — Verify the SDK is initialised
If the SDK never initialises, nothing is sent, and every later check fails for the wrong reason. Start here.
Where: your website or app build, not the NVECTA console
Check initialisation per platform
- Website - verify the tracking code is installed on the page, using the tracking code verification guide
- Android - check the SDK initialisation logs in the Logcat window, filtered on the NotifyVisitors tag, as described in the Android SDK getting started guide
- iOS - check the SDK initialisation logs and confirm the SDK is initialised with nvMode set to debug in the build you are testing, as described in the iOS SDK integration guide
If the SDK is not initialising: confirm the integration is in place for the platform you are testing. For a website, open Settings → Store Integration. Under the Direct Integration tab, cross-check that the same JS script exists on your page.
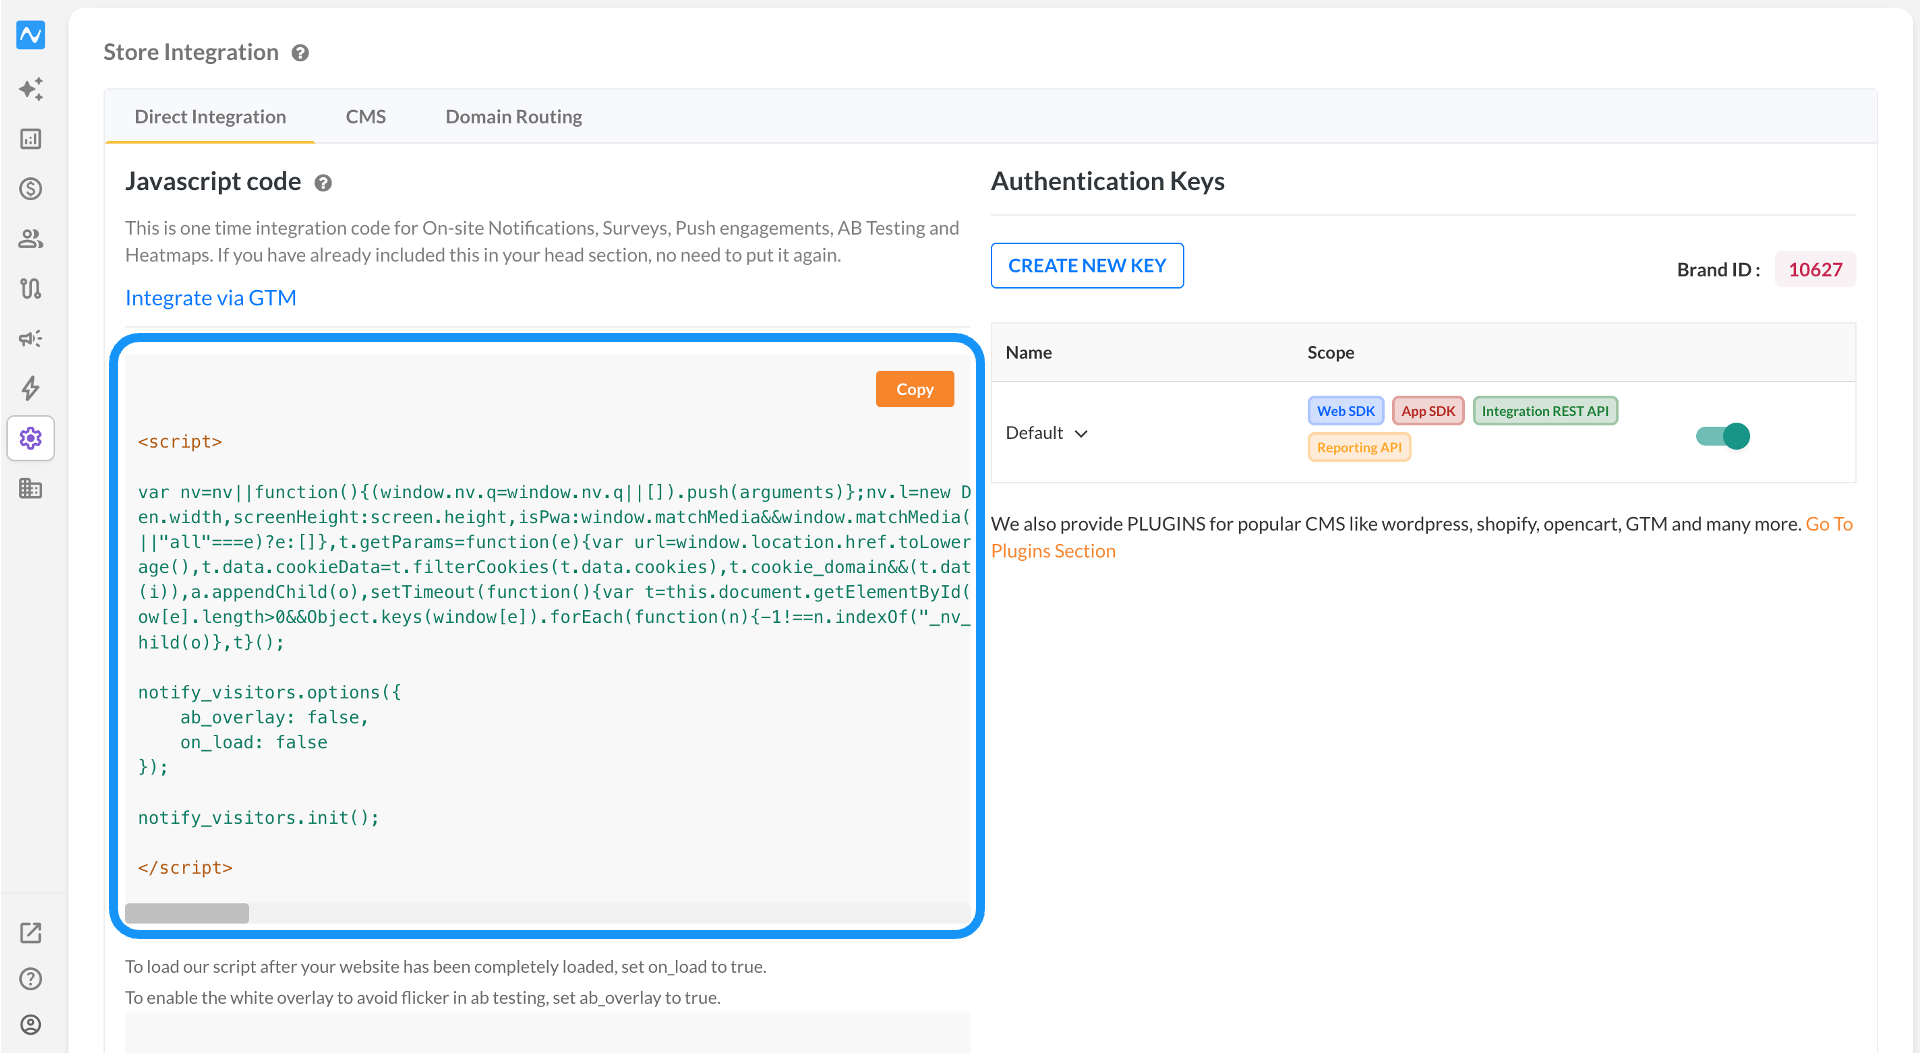
If you integrated through Google Tag Manager instead, check the tag there: the same script should sit in a published Custom HTML tag, on a trigger that covers the pages you are testing, and GTM’s Preview mode shows whether it actually fires. See the Integration via GTM guide.
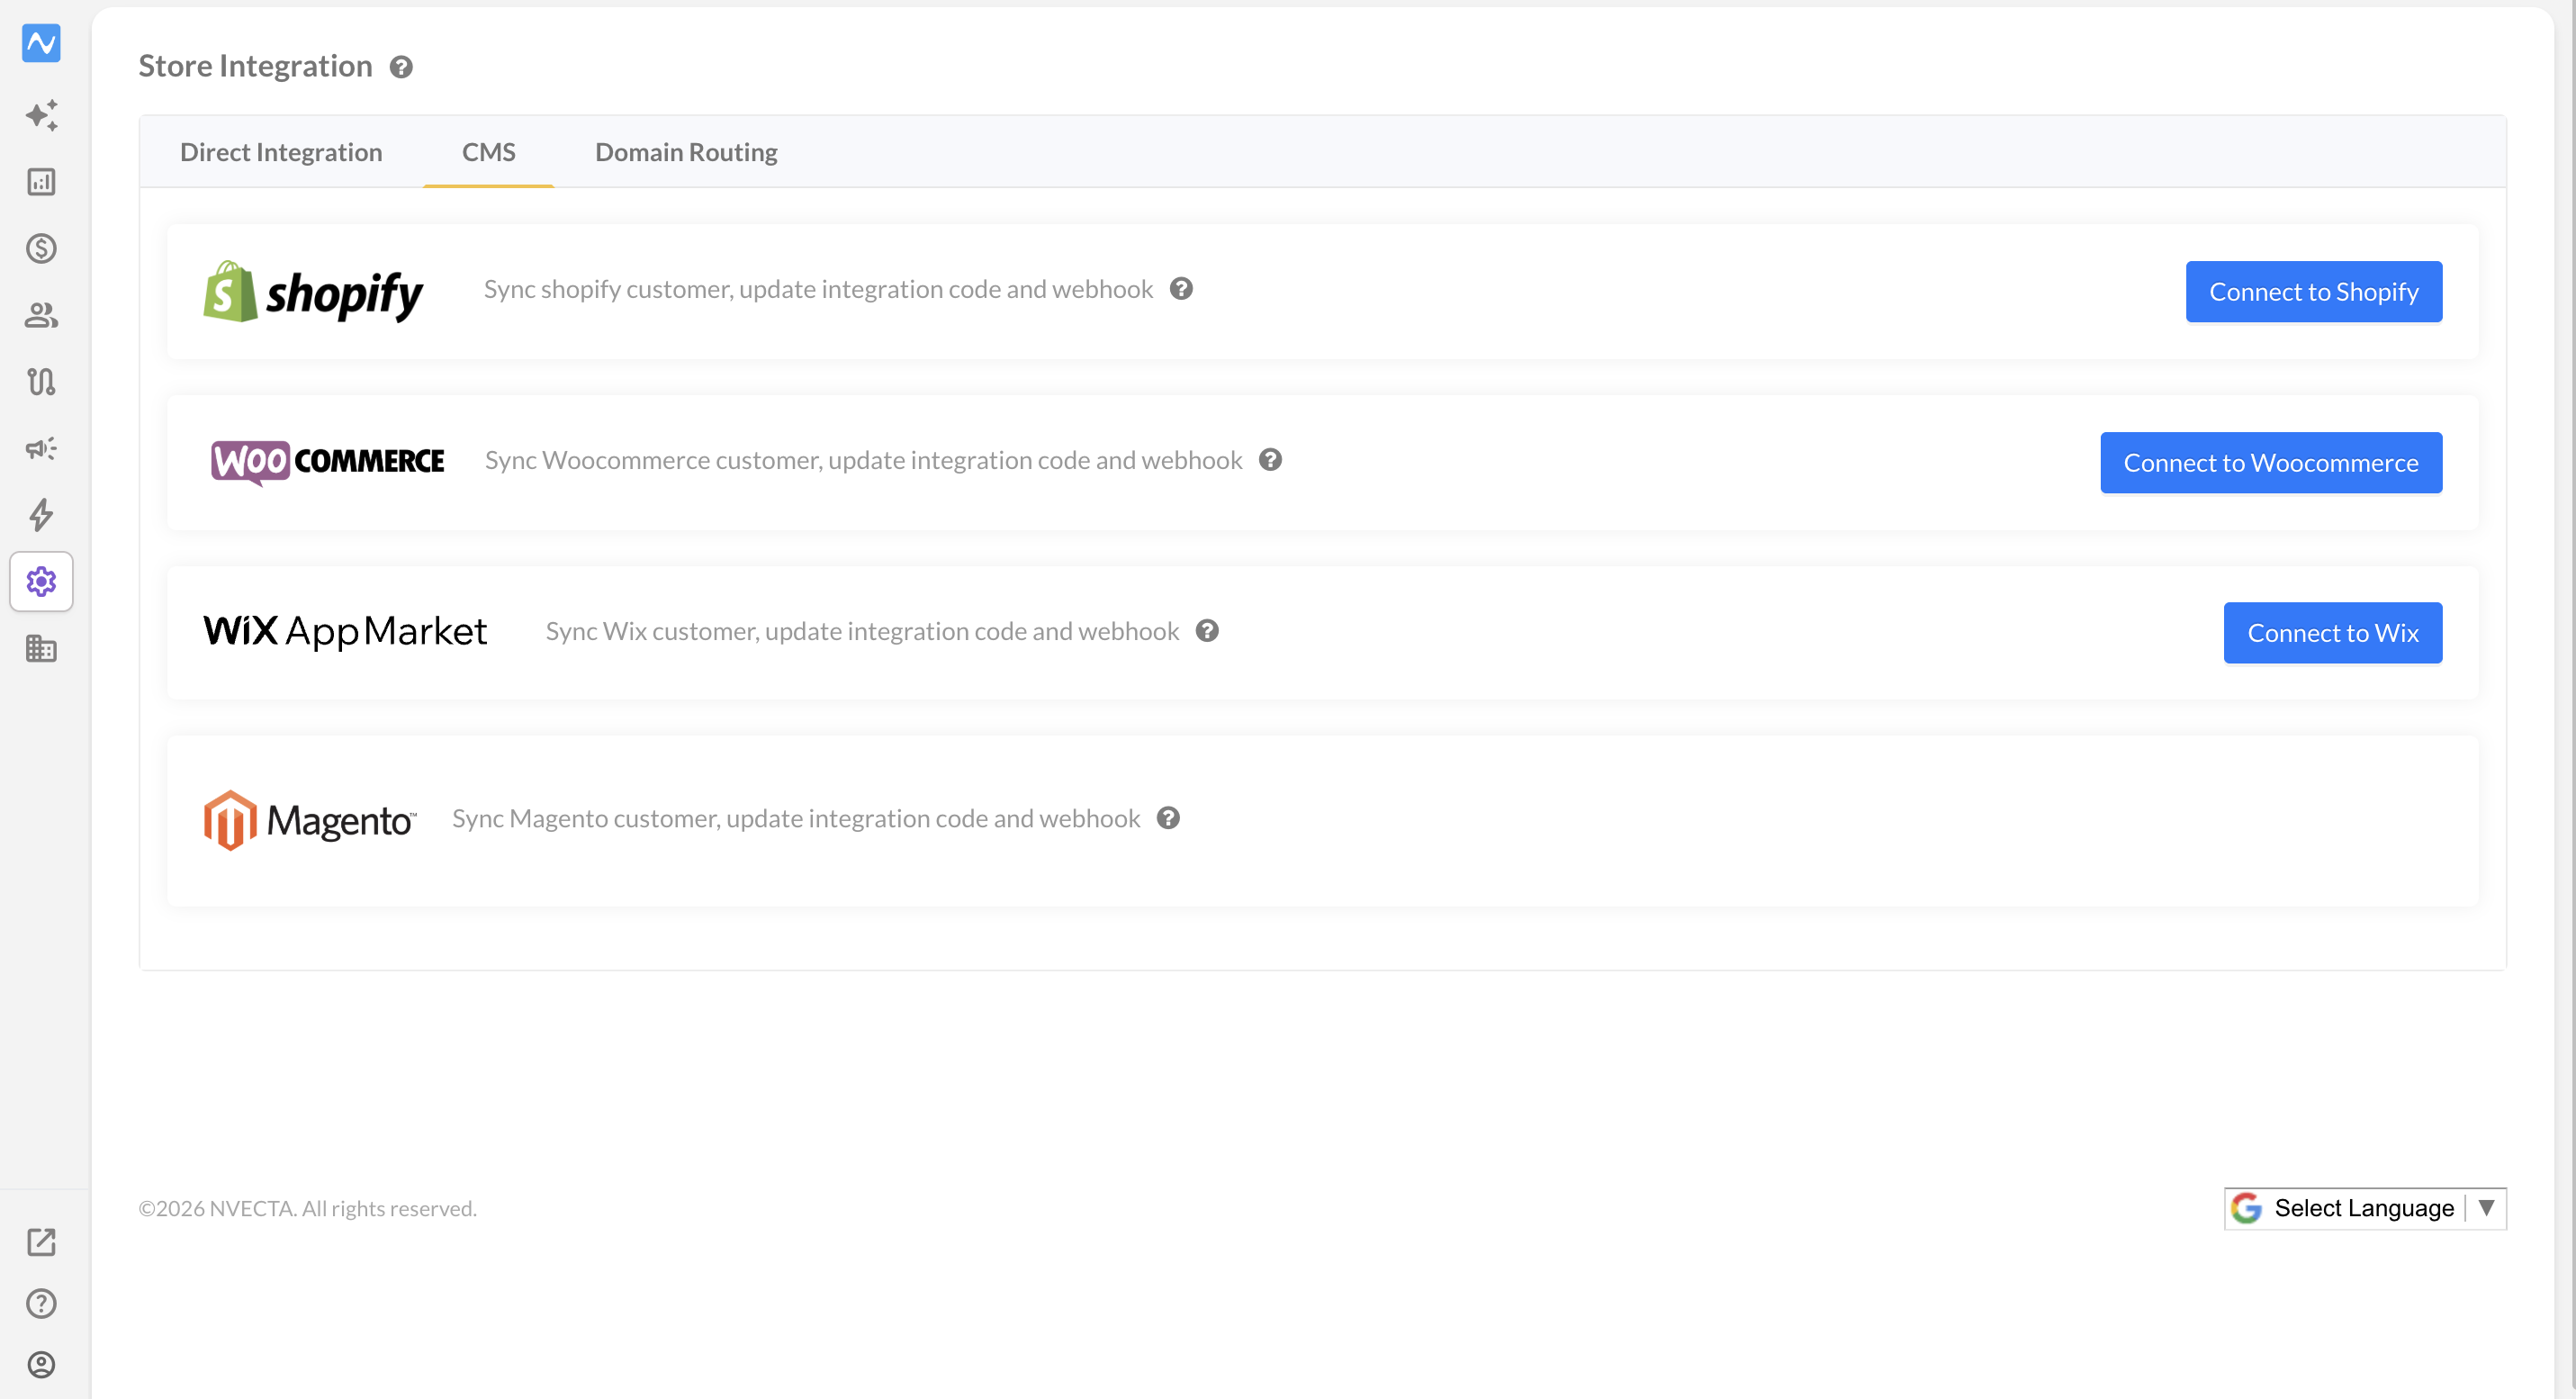
For a CMS platform, check the CMS tab for your platform - Shopify, WooCommerce, Wix or Magento.
How to read the result
| What you see | What it means |
|---|---|
| nv_ requests visible in the browser Network tab | The tracking code is installed, and the SDK is loading |
| No NVECTA requests on the page at all | The tracking code is missing, blocked or placed incorrectly - nothing will track until that is fixed |
| No initialisation line in Logcat or in the iOS logs | The SDK is not initialising in that build, so no event is ever queued |
Part 2 — Verify the Brand ID and credentials
An initialised SDK can still fail to record anything useful if it is pointed at the wrong Brand ID, which is the most common reason an event appears to be missing. A Brand ID that belongs to another project, is mistyped, does not exist, or is paired with a mismatched key will be rejected outright, so the event is stored nowhere. Before you go any further, confirm these three items.
Where: your website or app build, checked against the console
Confirm the Brand ID and keys
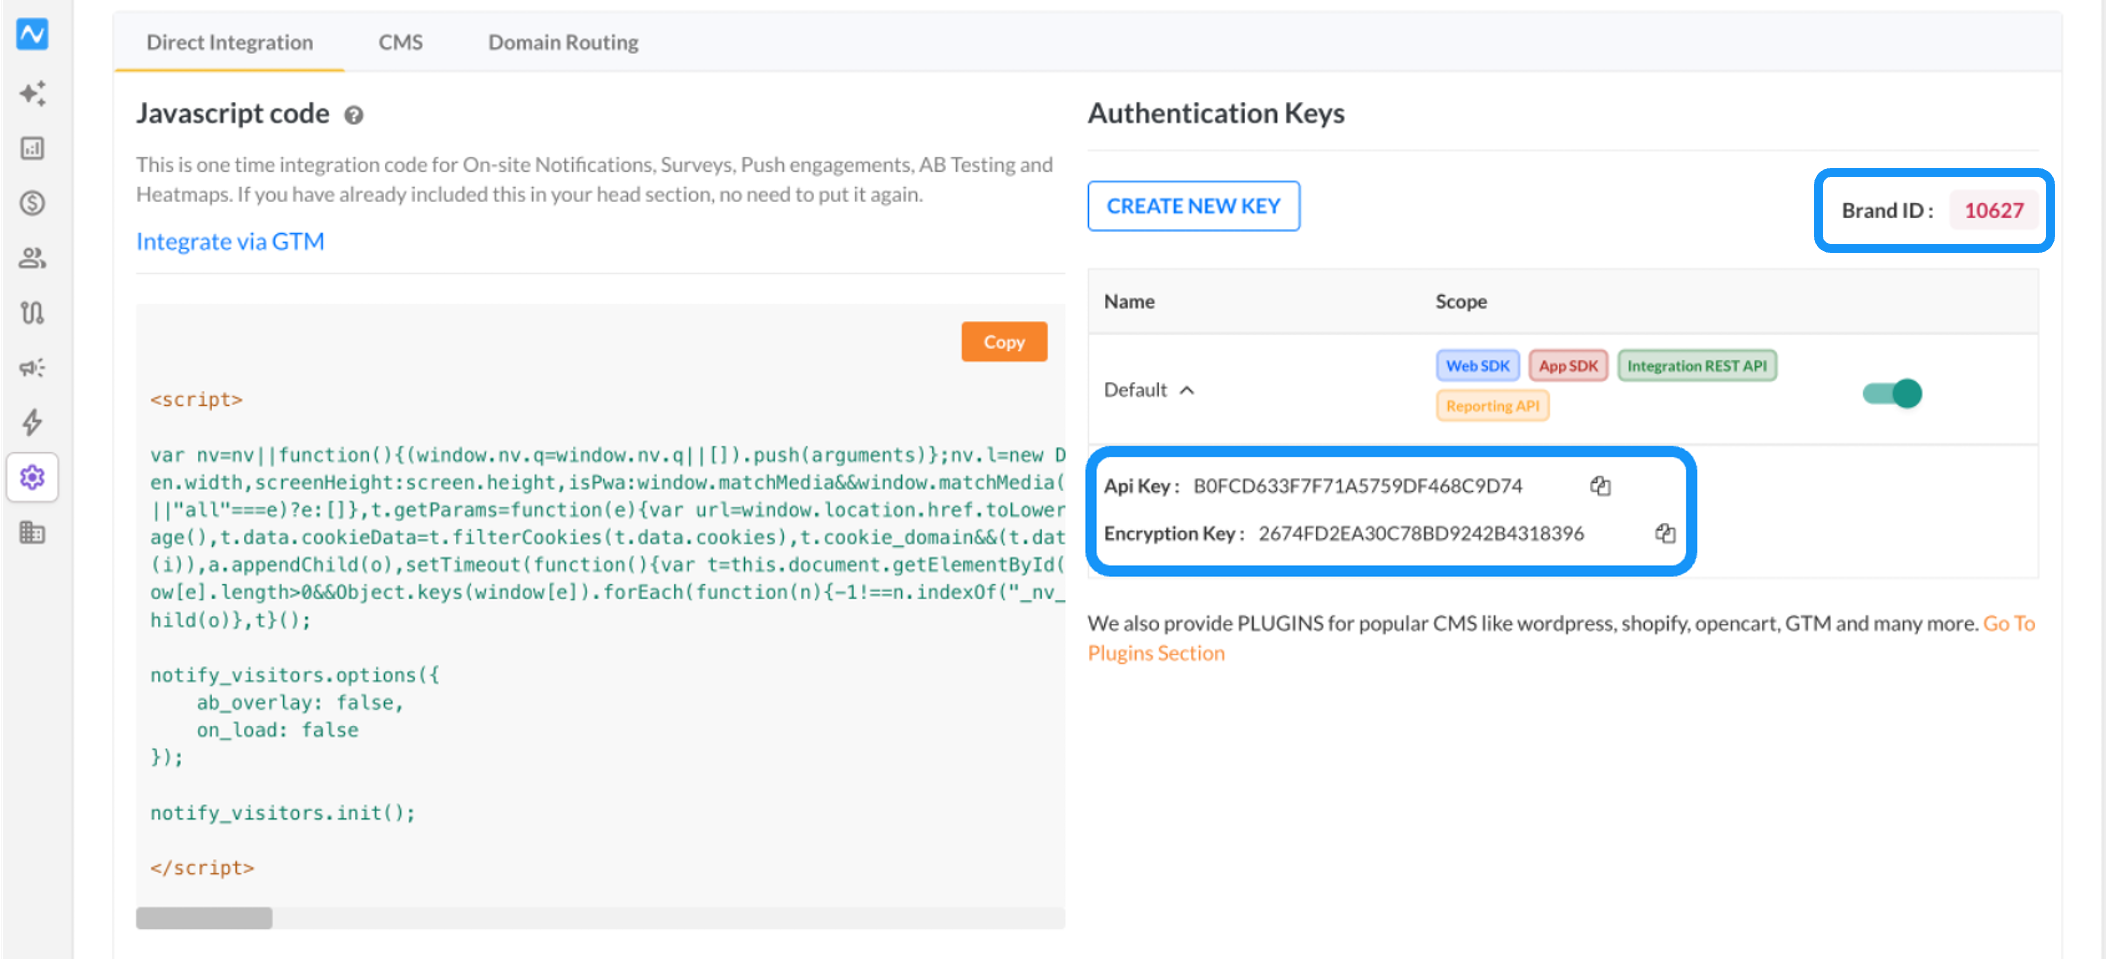
The Brand ID and the credentials are in the same place: Settings → Store Integration, on the Direct Integration tab. The Authentication Keys panel shows the Brand ID in its top-right corner, and expanding a key row reveals that key's API key and encryption key. Compare each of those values against what your build is actually sending - a single mismatch is enough for the event to be refused.
Confirm the credentials per platform
- Website - re-check the brand identifiers in the tracking code on the page against the console.
- Android - confirm notifyvisitors_bid and notifyvisitors_bid_e in AndroidManifest.xml, or the brand ID and encryption key passed to the registration method in your application class
- iOS - confirm the brand ID and encryption key passed when the SDK is initialised
Confirm you are looking at the right environment
The most common cause here is a credential mix-up between environments. NVECTA is normally set up with separate staging (UAT) and Production accounts, each with its own Brand ID, encryption key and API key, so it is easy for a staging Brand ID or key to be left behind in the tracking code, or for a staging SDK configuration to be shipped, when a site or app goes live. When that happens, the events are tracked perfectly well, they simply land in the other account.
Check the live site or store build against the Production credentials and the test build against the staging ones, and rule out anything carried over from the other environment before you decide the event is missing.
For how the two accounts are provisioned, see Platform Setup.
How to read the result
| What you see | What it means |
|---|---|
| Brand ID in the build matches the console | The integration is pointing at this project; move on |
| Brand ID matches but the key does not | The request is rejected before it is stored; expect an authentication error in the logs |
| Events appear in UAT but not in Production | The build is still pointed at the UAT account |
| The app callback returns "Authentication failed." | The brand ID and key pair is not valid for this account |
Part 3 — Verify the event request is fired
Parts 1 and 2 prove the SDK can talk to the right project. This check proves the event call itself runs. If nothing leaves the device, no amount of console configuration will help.
Where: the browser or device first, then Analytics → Live Stats to confirm arrival
Check the request per platform
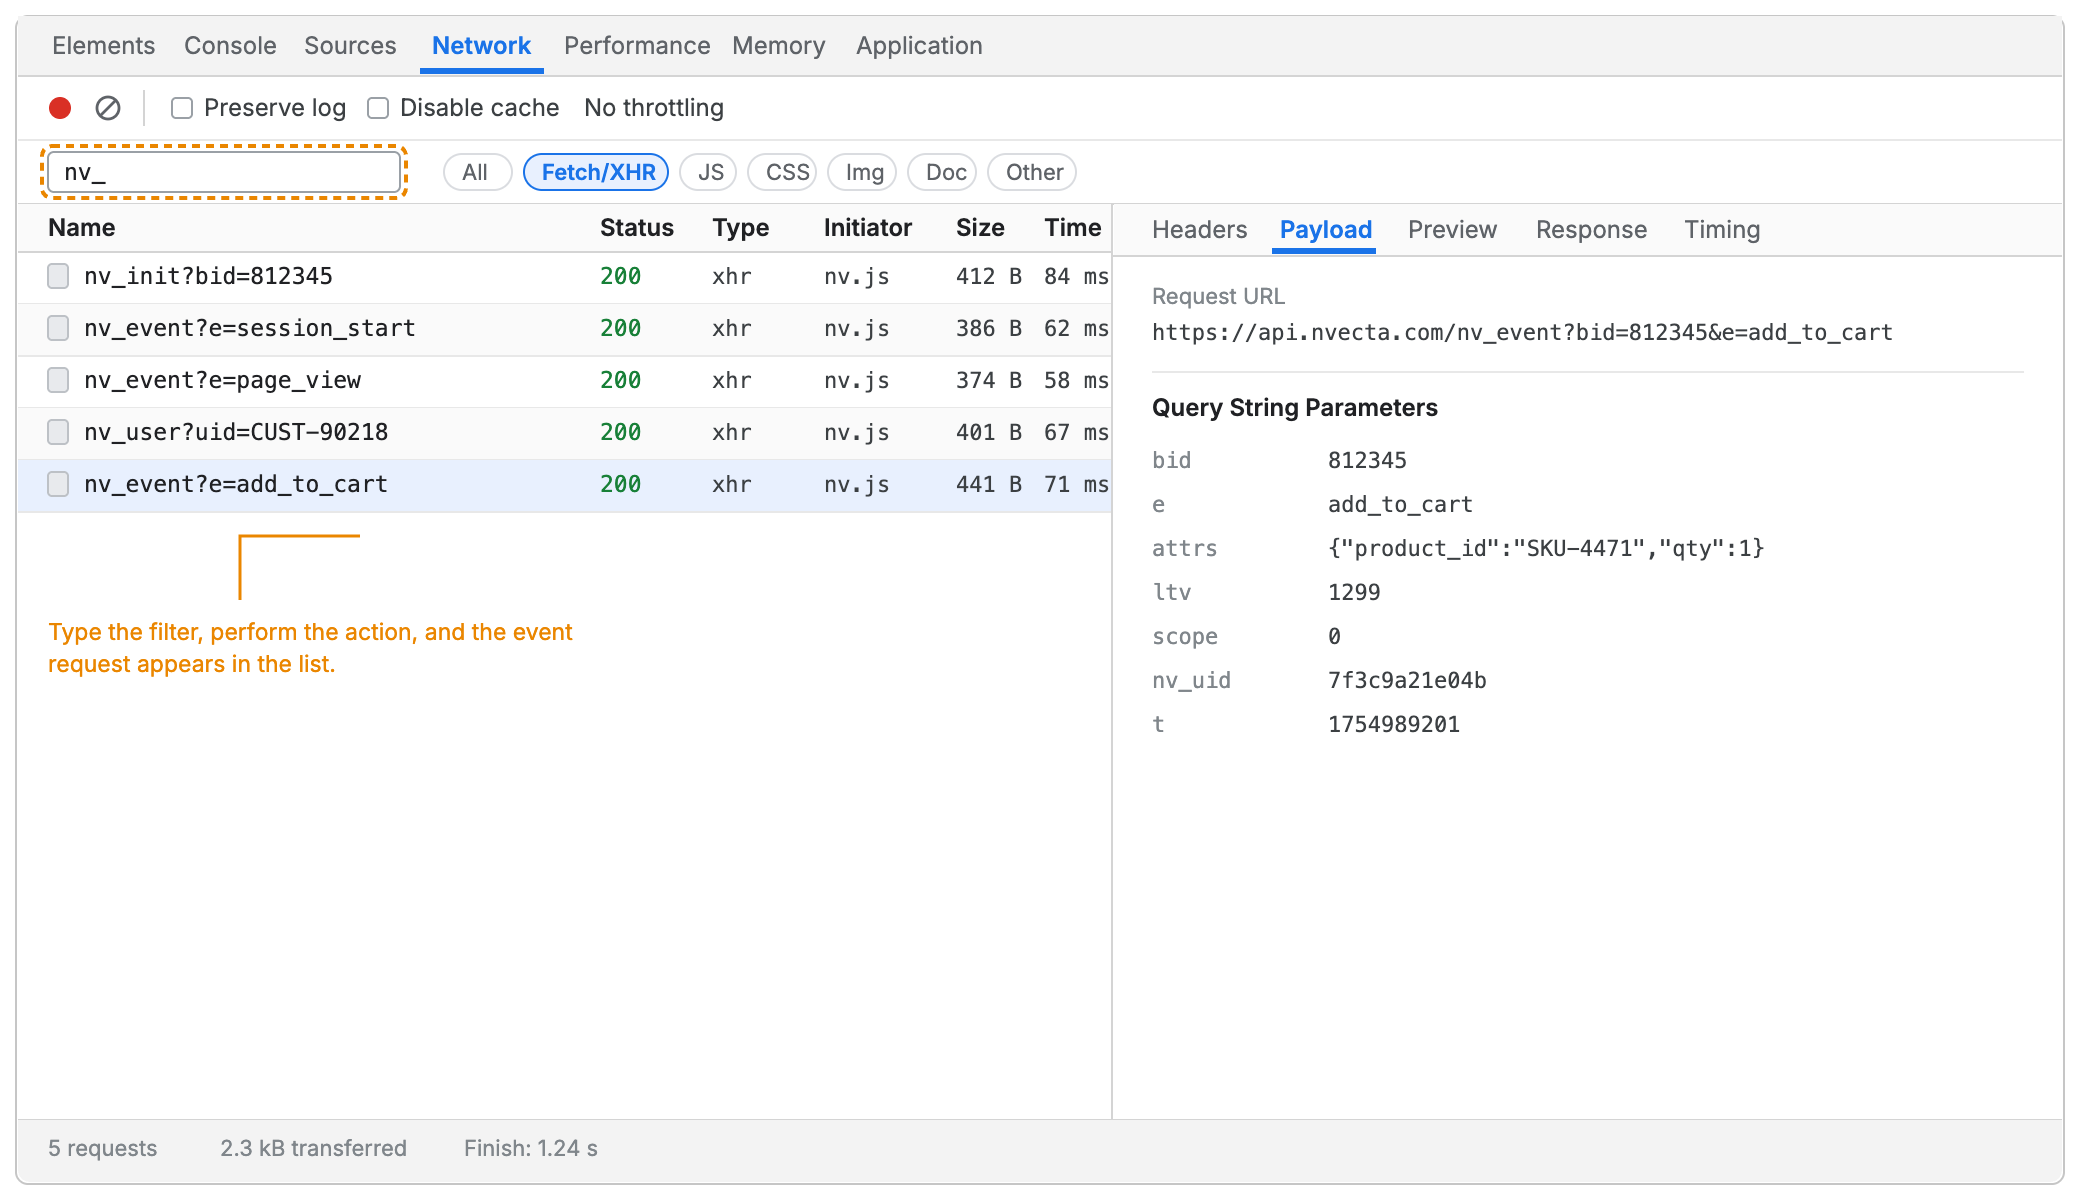
- Website - open the browser developer tools, go to Network, filter on nv_ and perform the action; the event request should appear
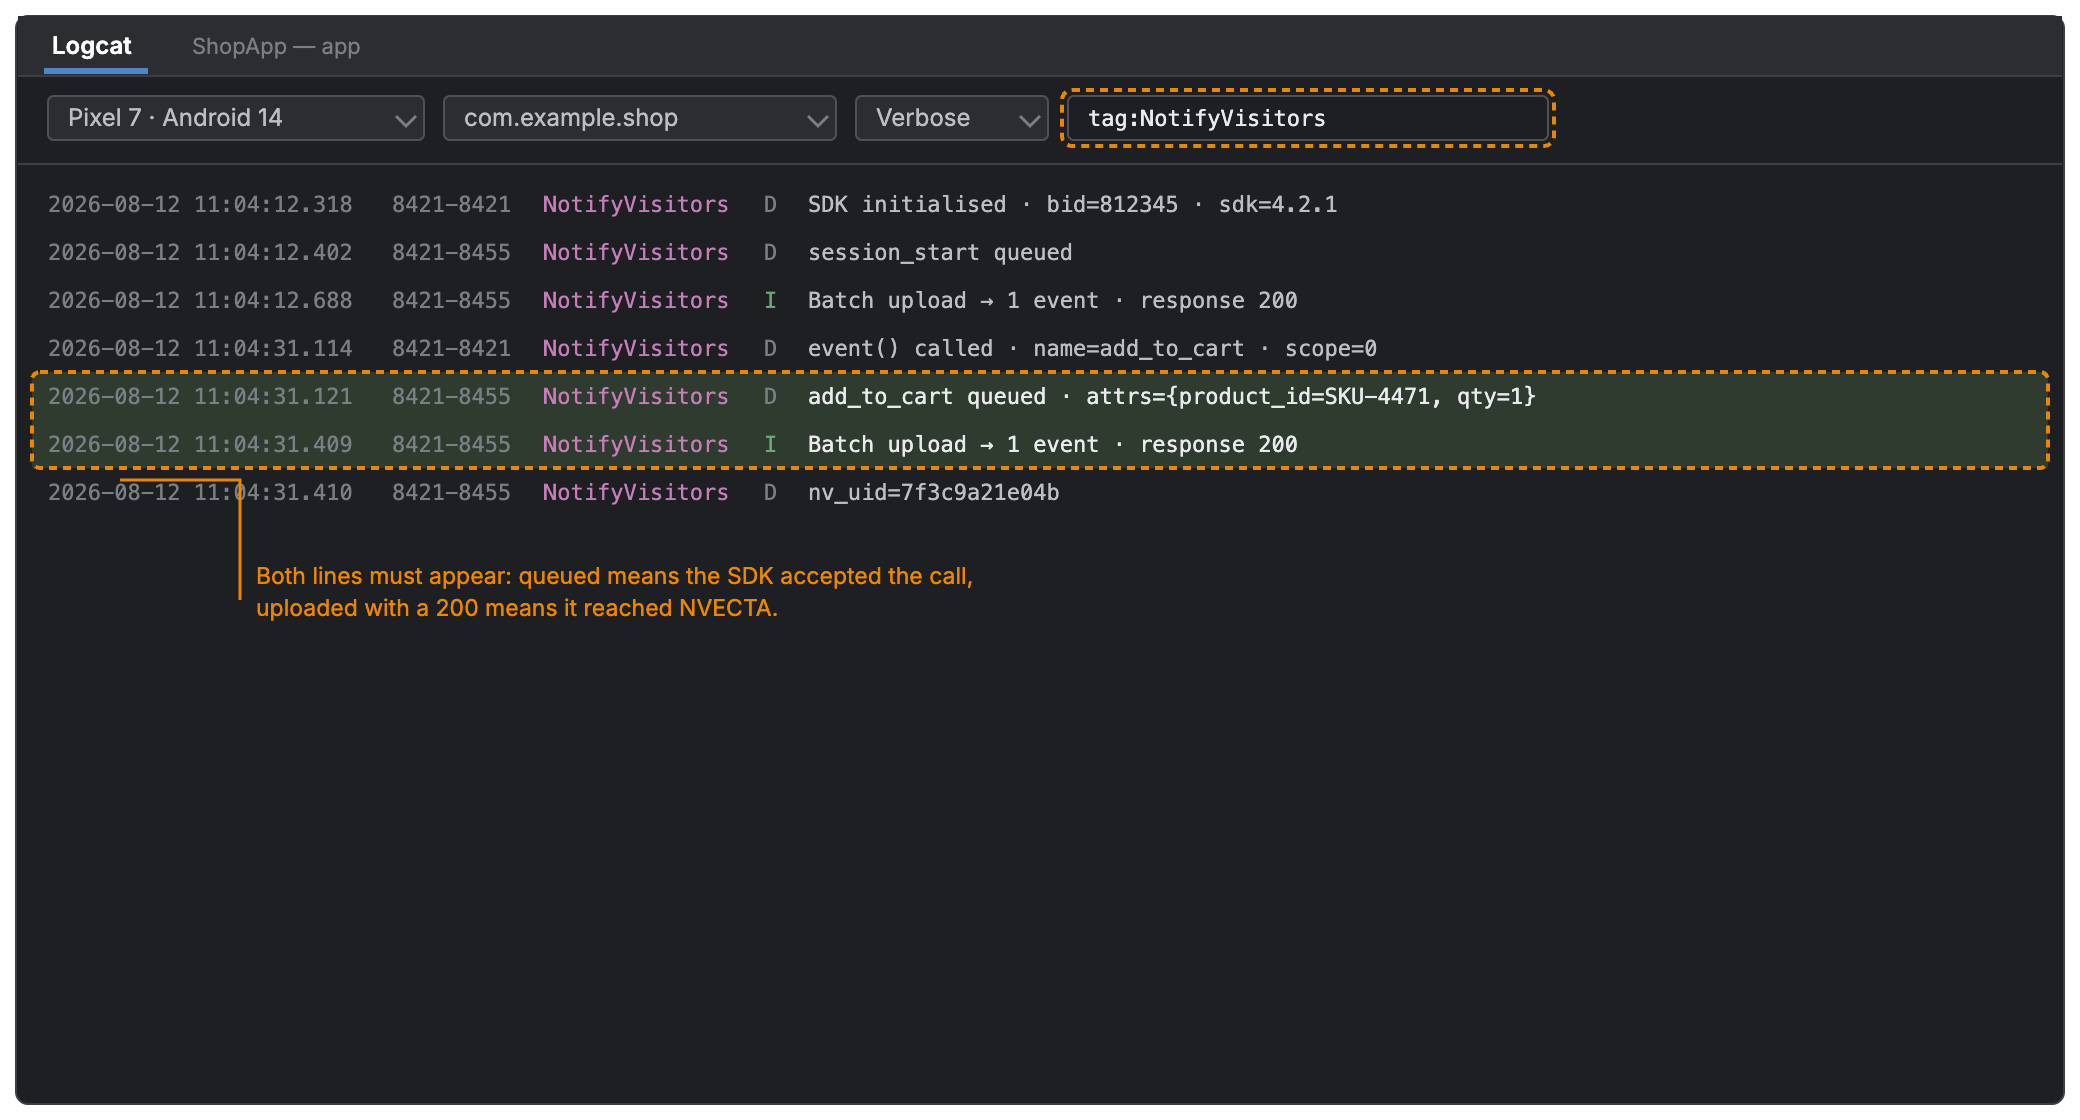
- Android - check the SDK logs for the event being queued and uploaded after your event call runs
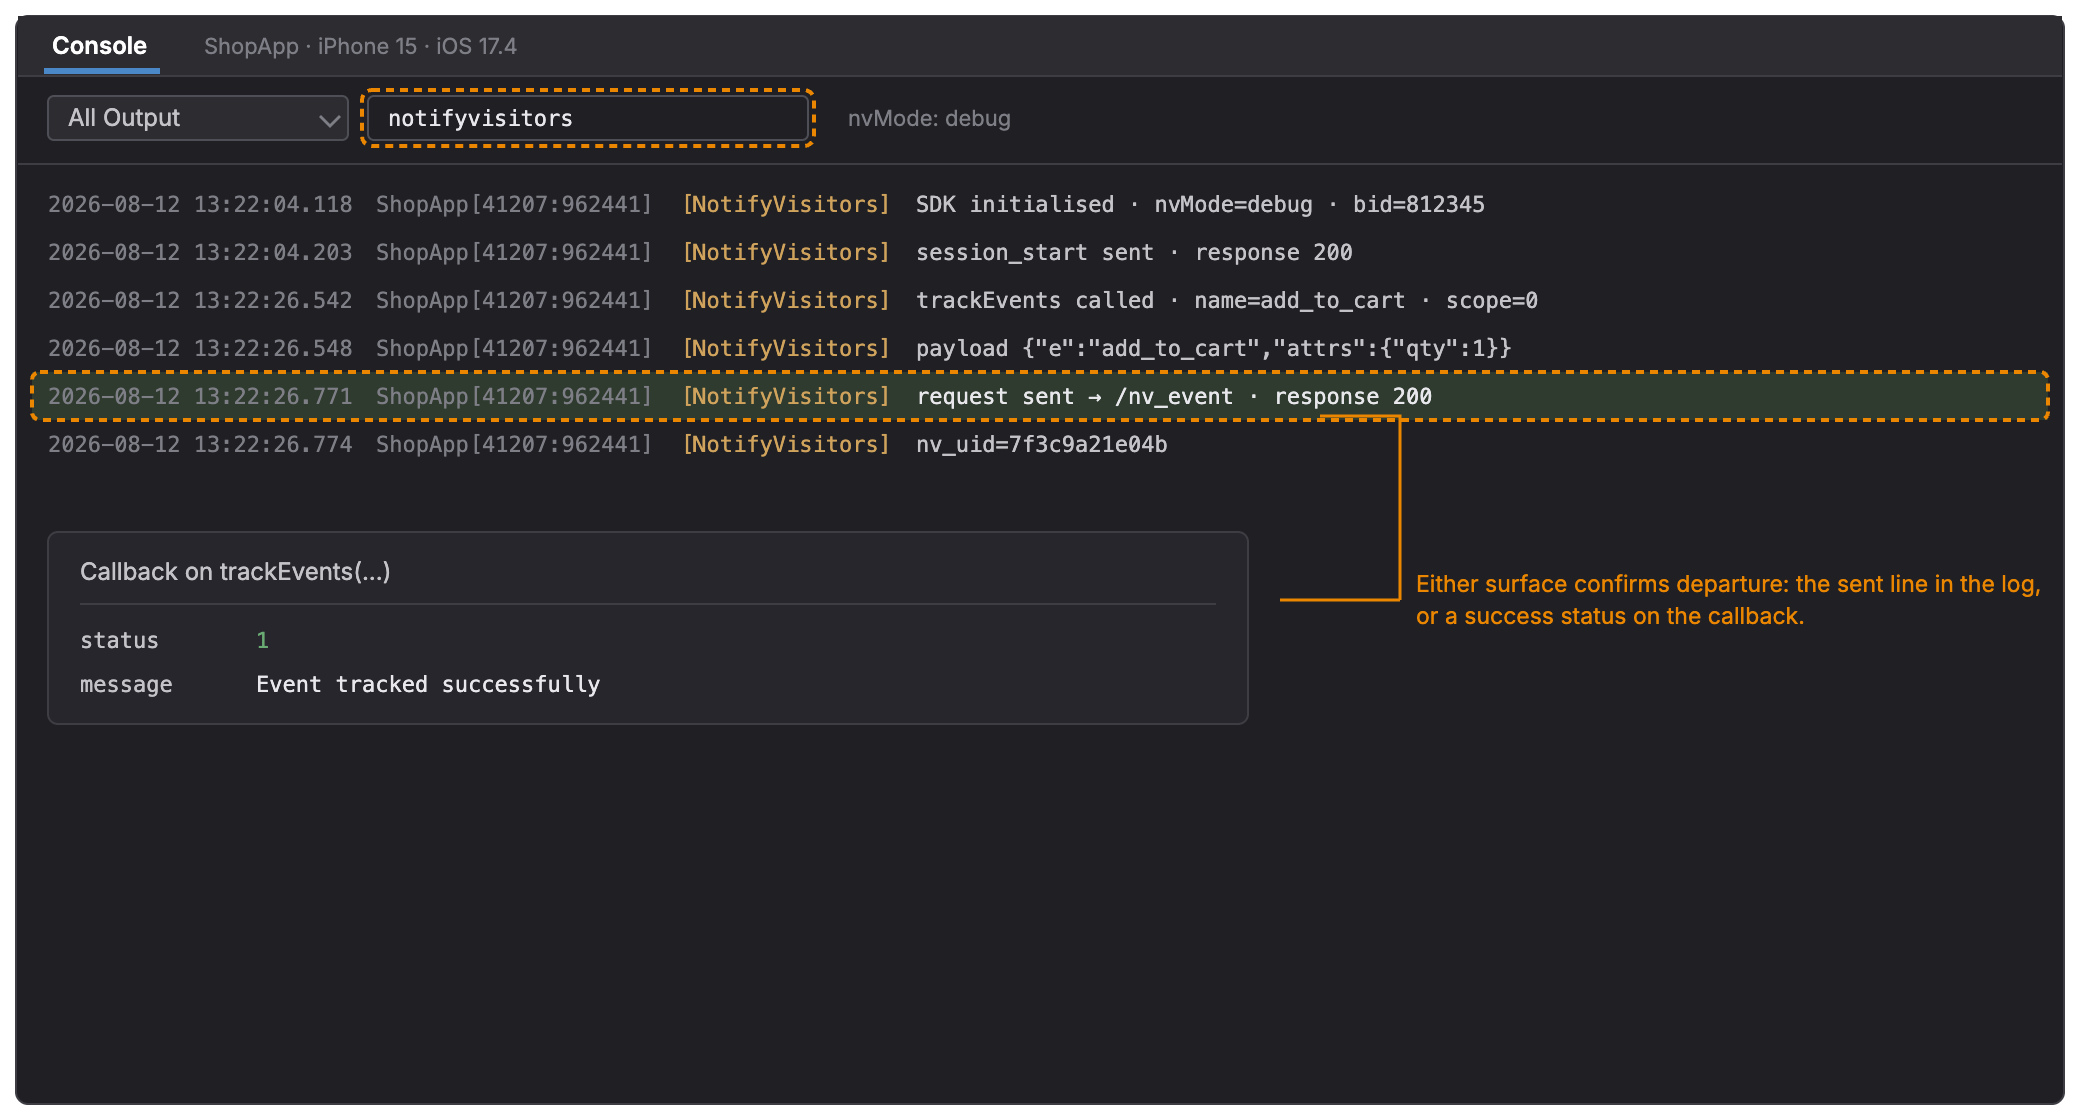
- iOS - check the SDK logs, or the callback on the event call, to confirm the request was sent
Confirm the event call is running
If no request is generated at all, the event call in your application is not executing. The method differs per platform:
- Website - nv('event', EVENT_NAME, EVENT_ATTRIBUTES, LIFETIME_VALUE, SCOPE)
- Android - NotifyVisitorsApi.getInstance(activityContext).event(...)
- iOS - notifyvisitors.trackEvents(...)
Two things catch people out here. The call may sit behind a condition that never becomes true, and it may run before the SDK has finished initialising. Also check the SCOPE value you are passing: an event set to track once per session will look intermittent rather than broken.
If the event was configured in the console against a button rather than written in code, it is a static event, and the selector is the thing to check instead of the code. Learn more.
Confirm arrival, not just departure
Perform the action, then open Analytics → Live Stats and look for the event name in the last 30 minutes. That is the quickest confirmation that the request reached NVECTA rather than merely leaving the device. Learn more.
How to read the result
| What you see | What it means |
|---|---|
| Request in the Network tab and the event in Live Stats | The event is reaching NVECTA; the problem is further down the chain |
| Request fires, but the event never appears in Live Stats | The hit is being refused - continue with Part 4 and Part 5 |
| No request at all | The event call is not executing; check the condition around it and its order against SDK initialisation |
| Request fires on some sessions only | The event scope is set to once per session, or the call sits behind a condition |
Part 4 — Verify the console configuration
An event that is fired correctly can still be dropped because the project is not set up to accept it, or because the account has no room left for it. Three things decide that: two of them on the Events screen, and one on the billing page.
Where: Settings → Events, and Organization → Billing → Overview
Check that tracking is on
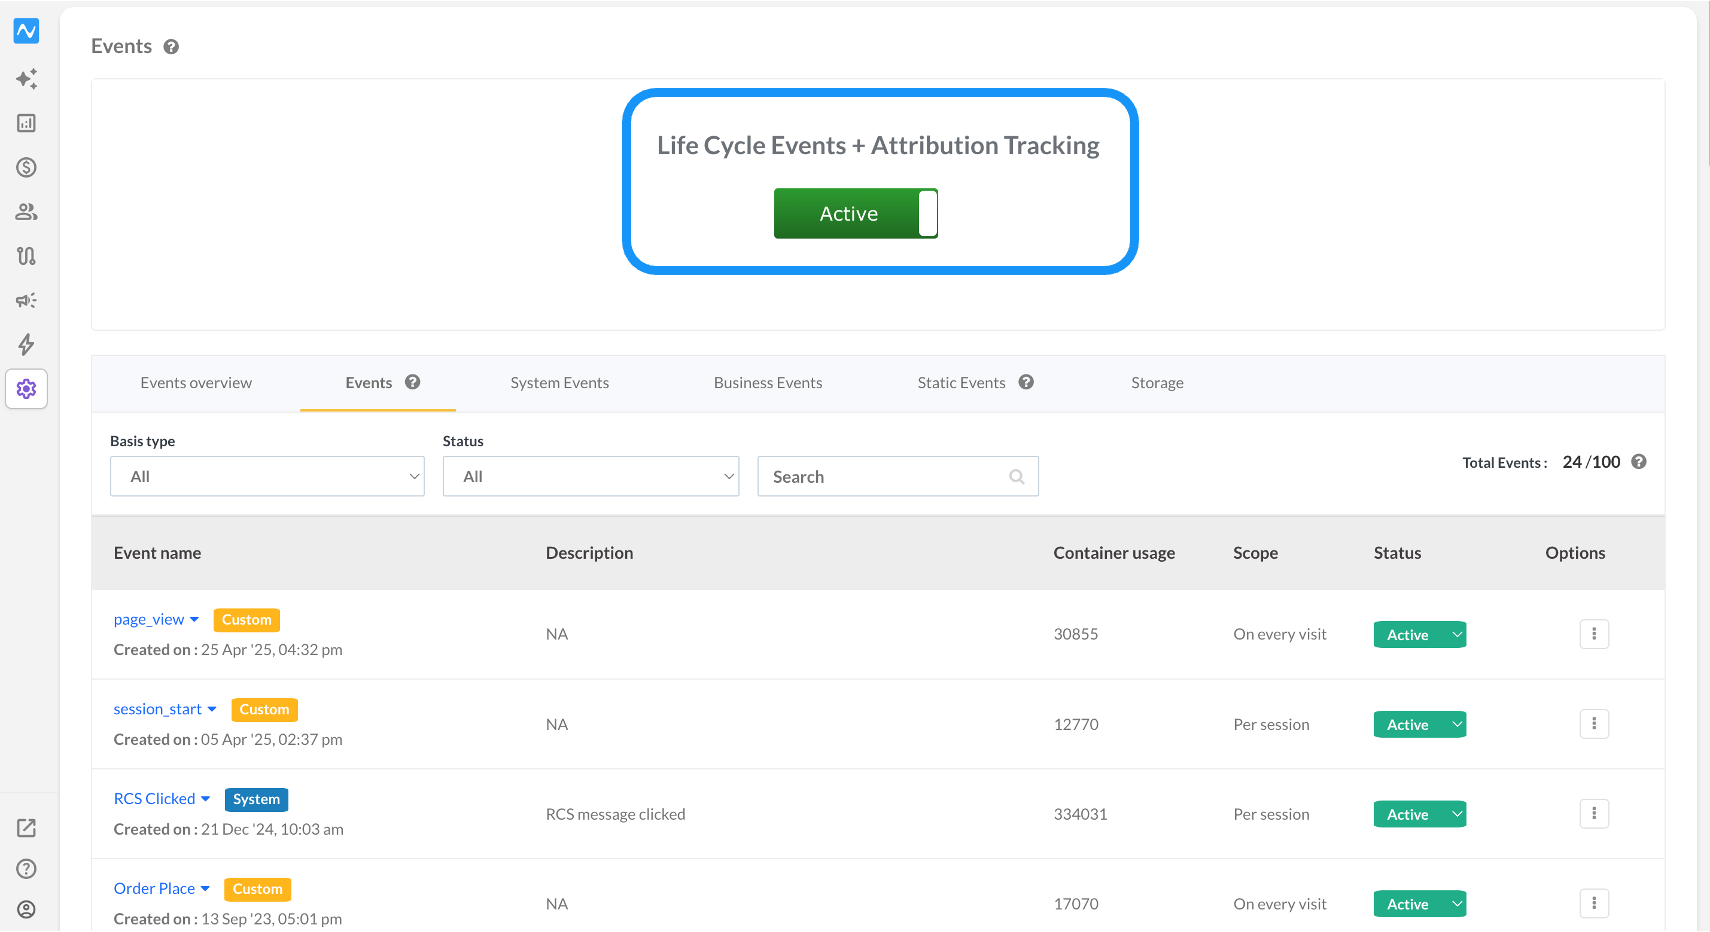
At the top of the Events screen, the Life Cycle Events + Attribution Tracking switch must read Active. While it is off, events are not recorded for the whole project.
Check the event itself
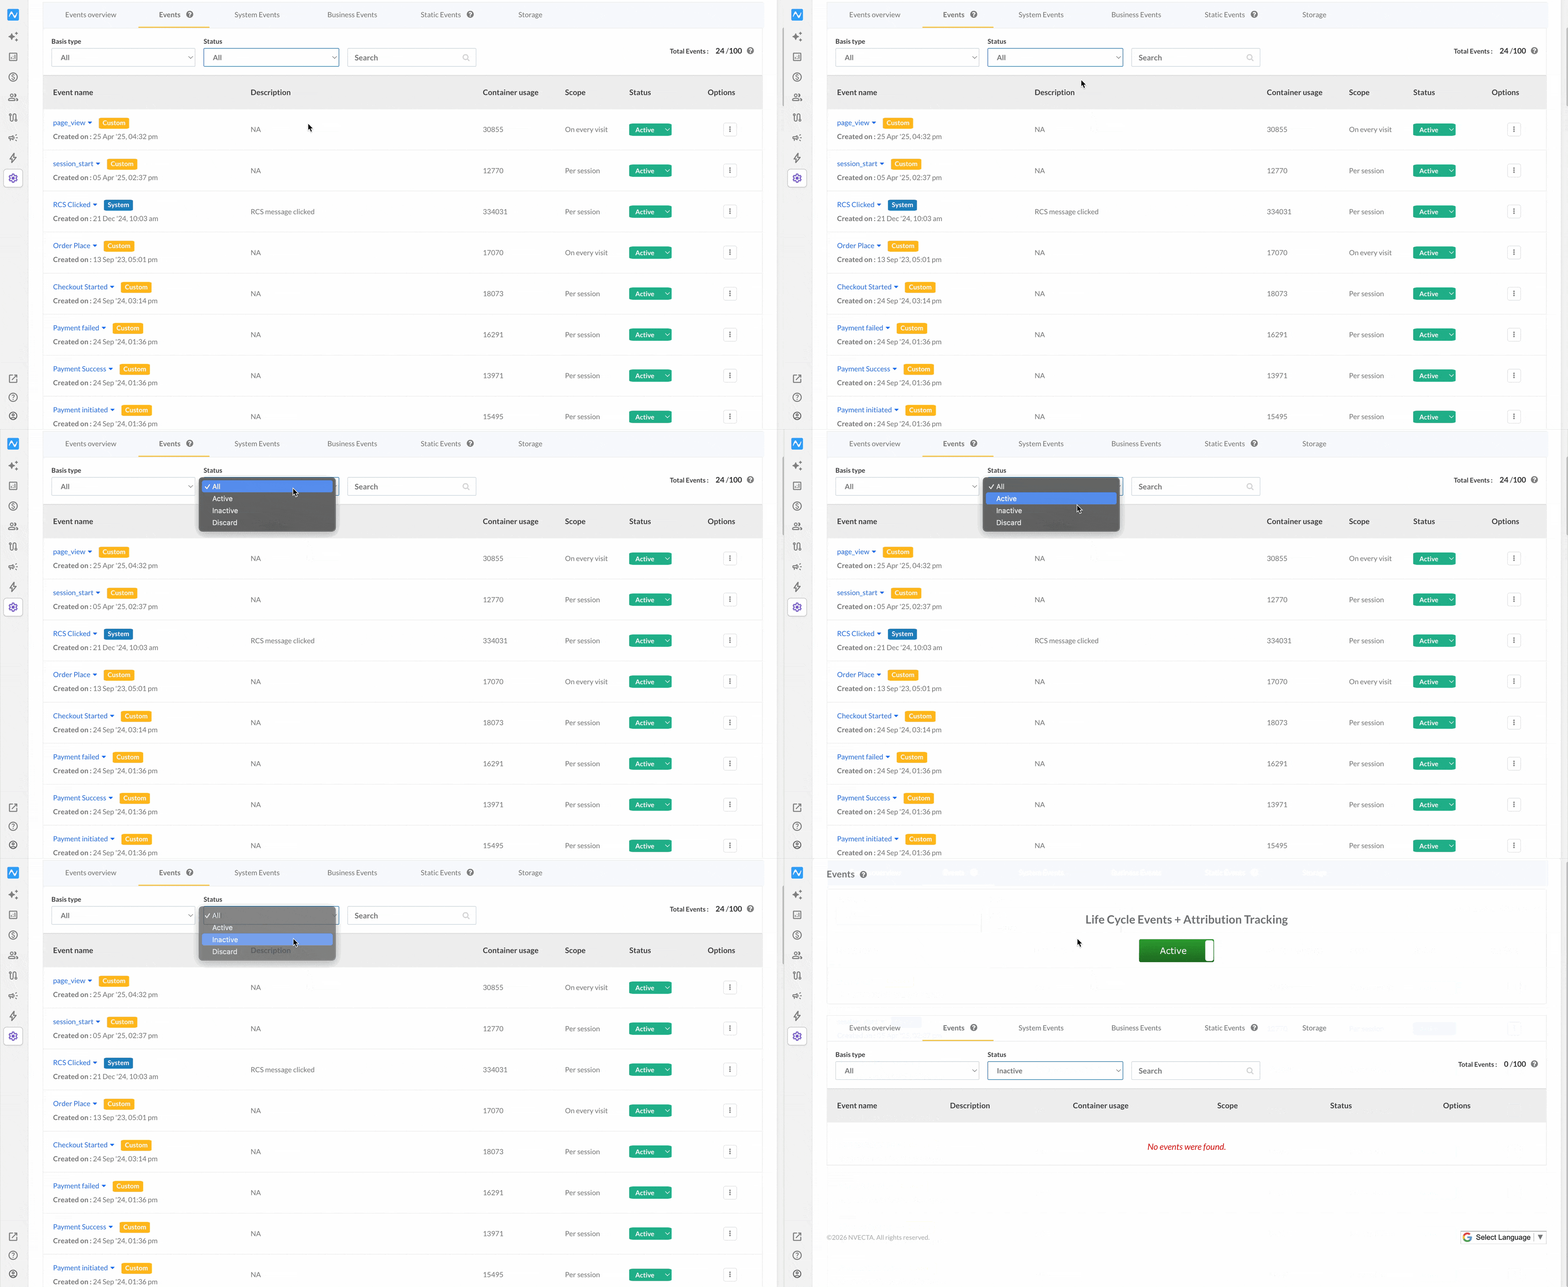
Open the Events tab and search for the event name, then read the Status column: it must be Active. The Basis type and Status filters above the table help you spot events that have been switched off.
If the event is not in the list at all, nothing has ever arrived under that name - compare it with the event call character for character, because spelling and case are treated literally.
For a system event such as session_start, page_view, or install, check the System Events tab instead; those can be turned off independently.
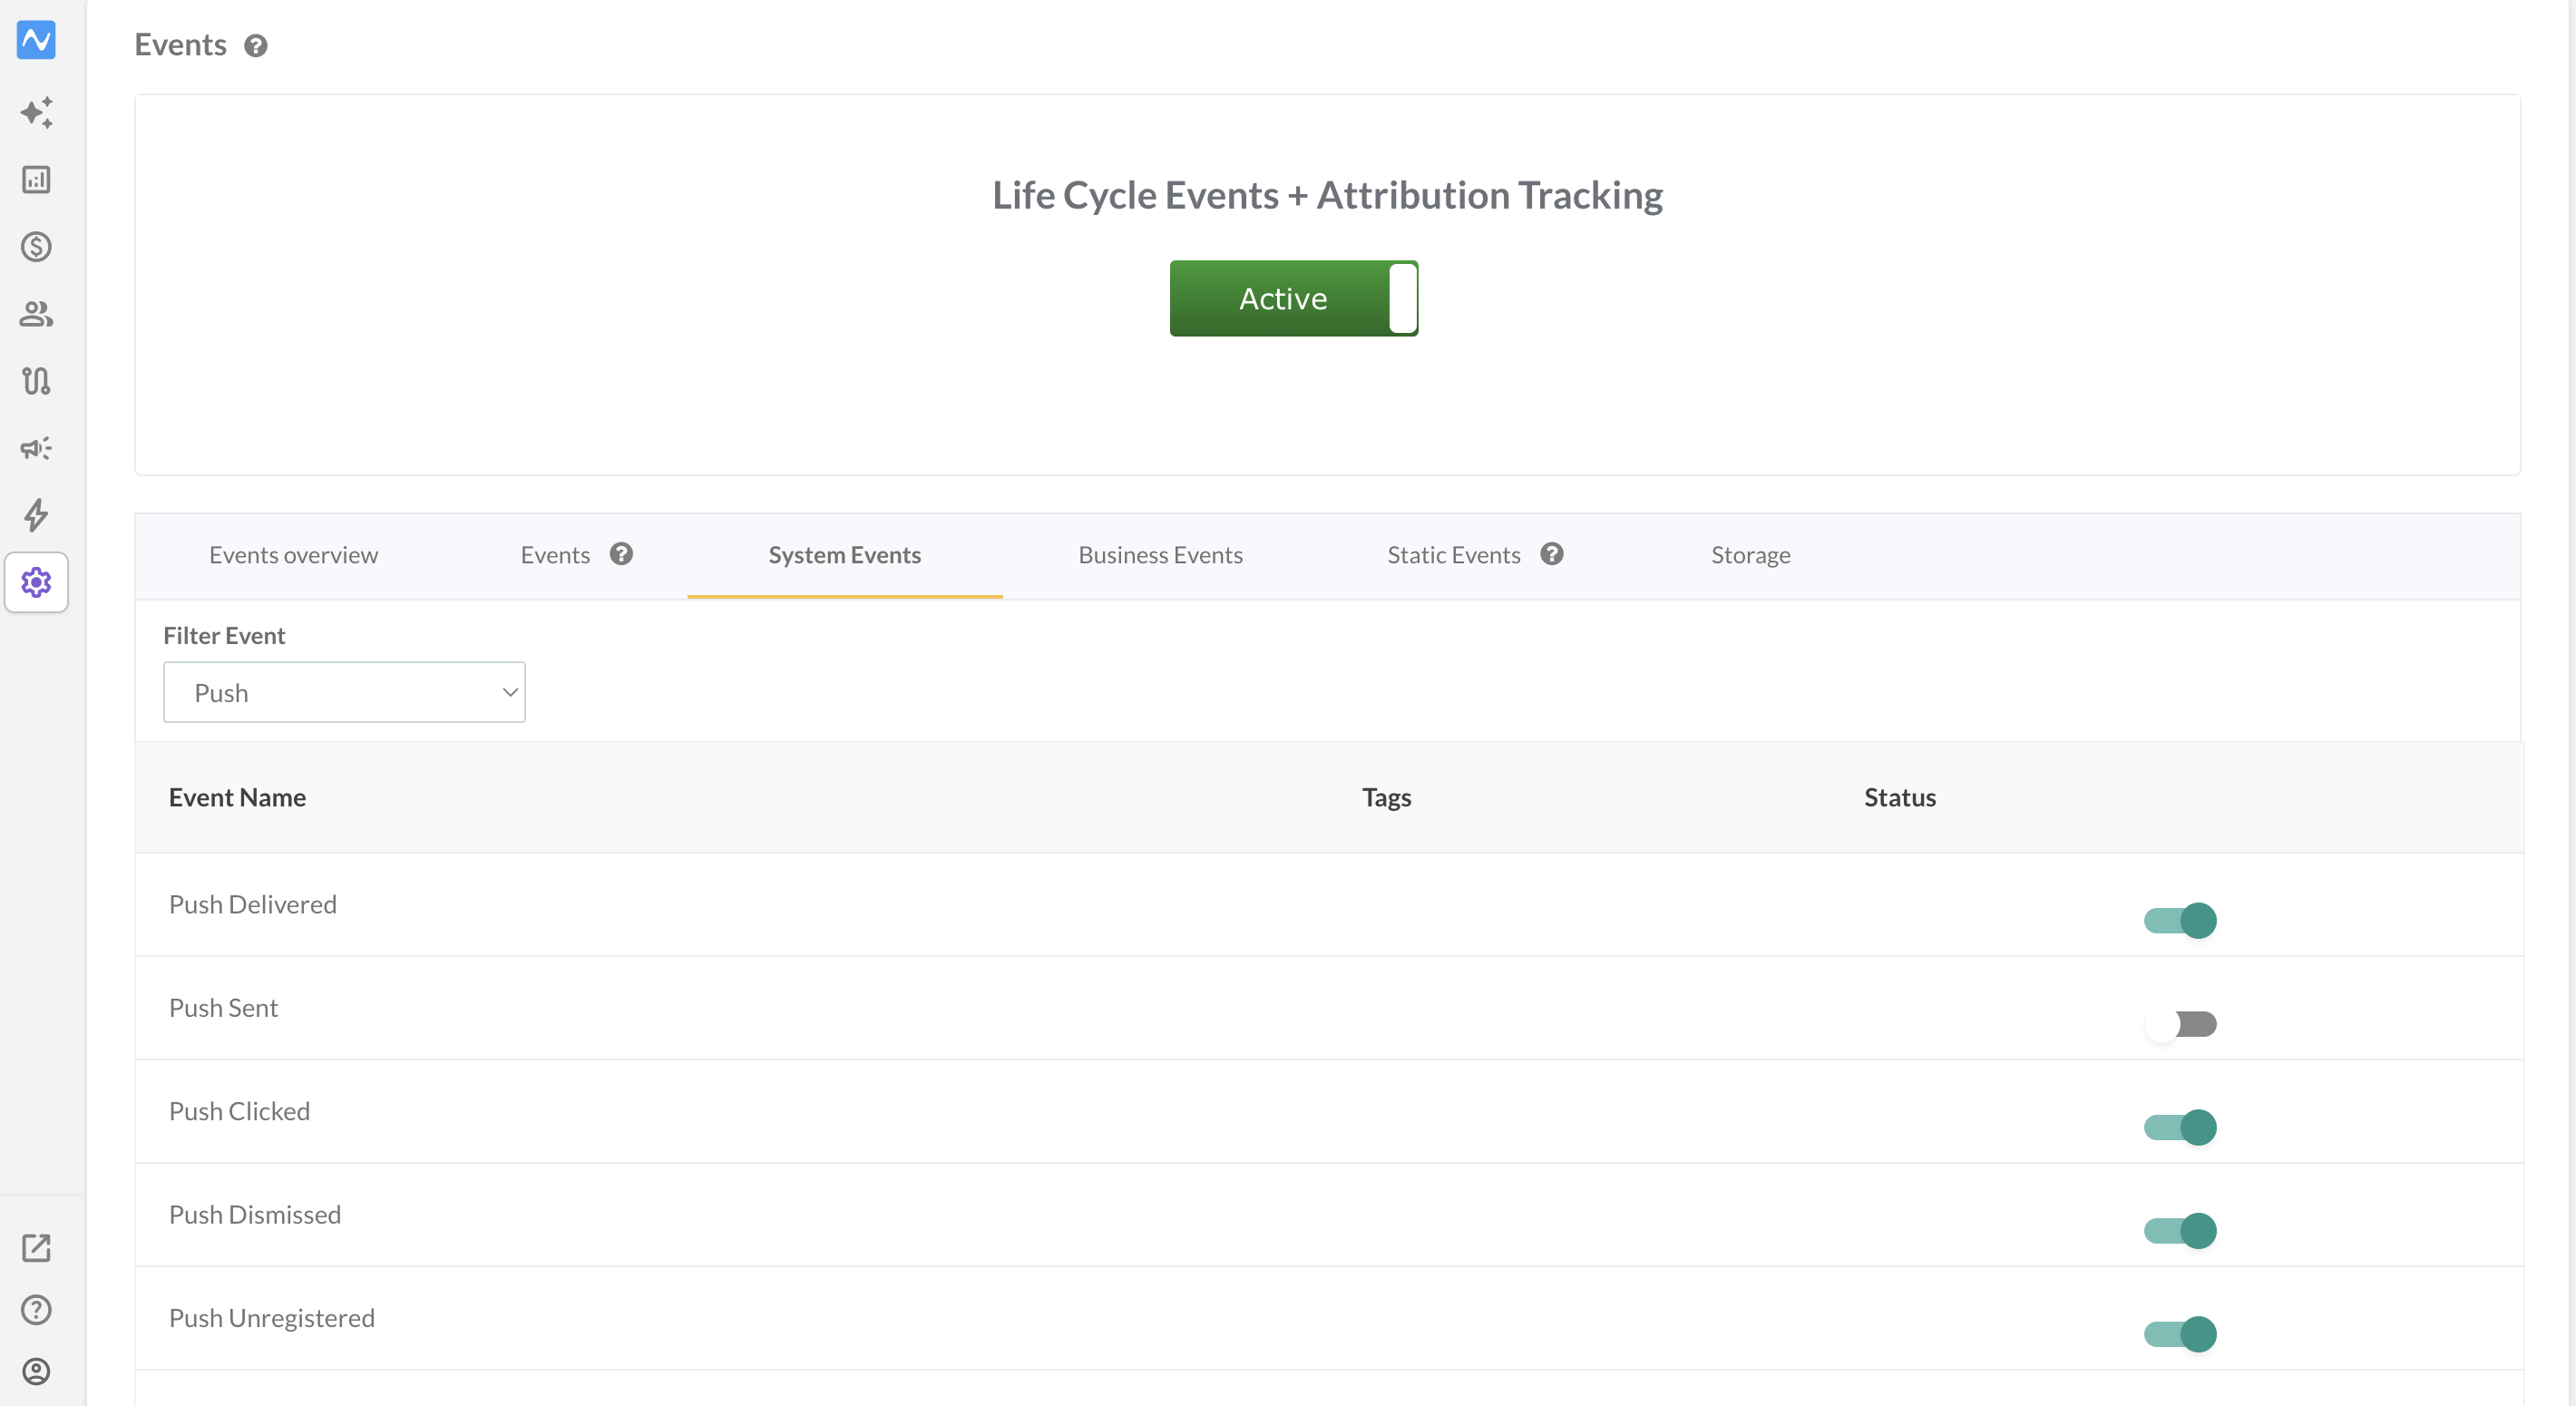
Event configuration guide: https://www.nvecta.com/support/solutions/articles/84000390131-event-configuration
Check the subscription and event limits
Two separate limits apply here, and either one can be the reason an event never appears.
The first is the number of distinct event names the project is allowed to hold. The Events tab shows this as a Total Events counter to the right of the filters.
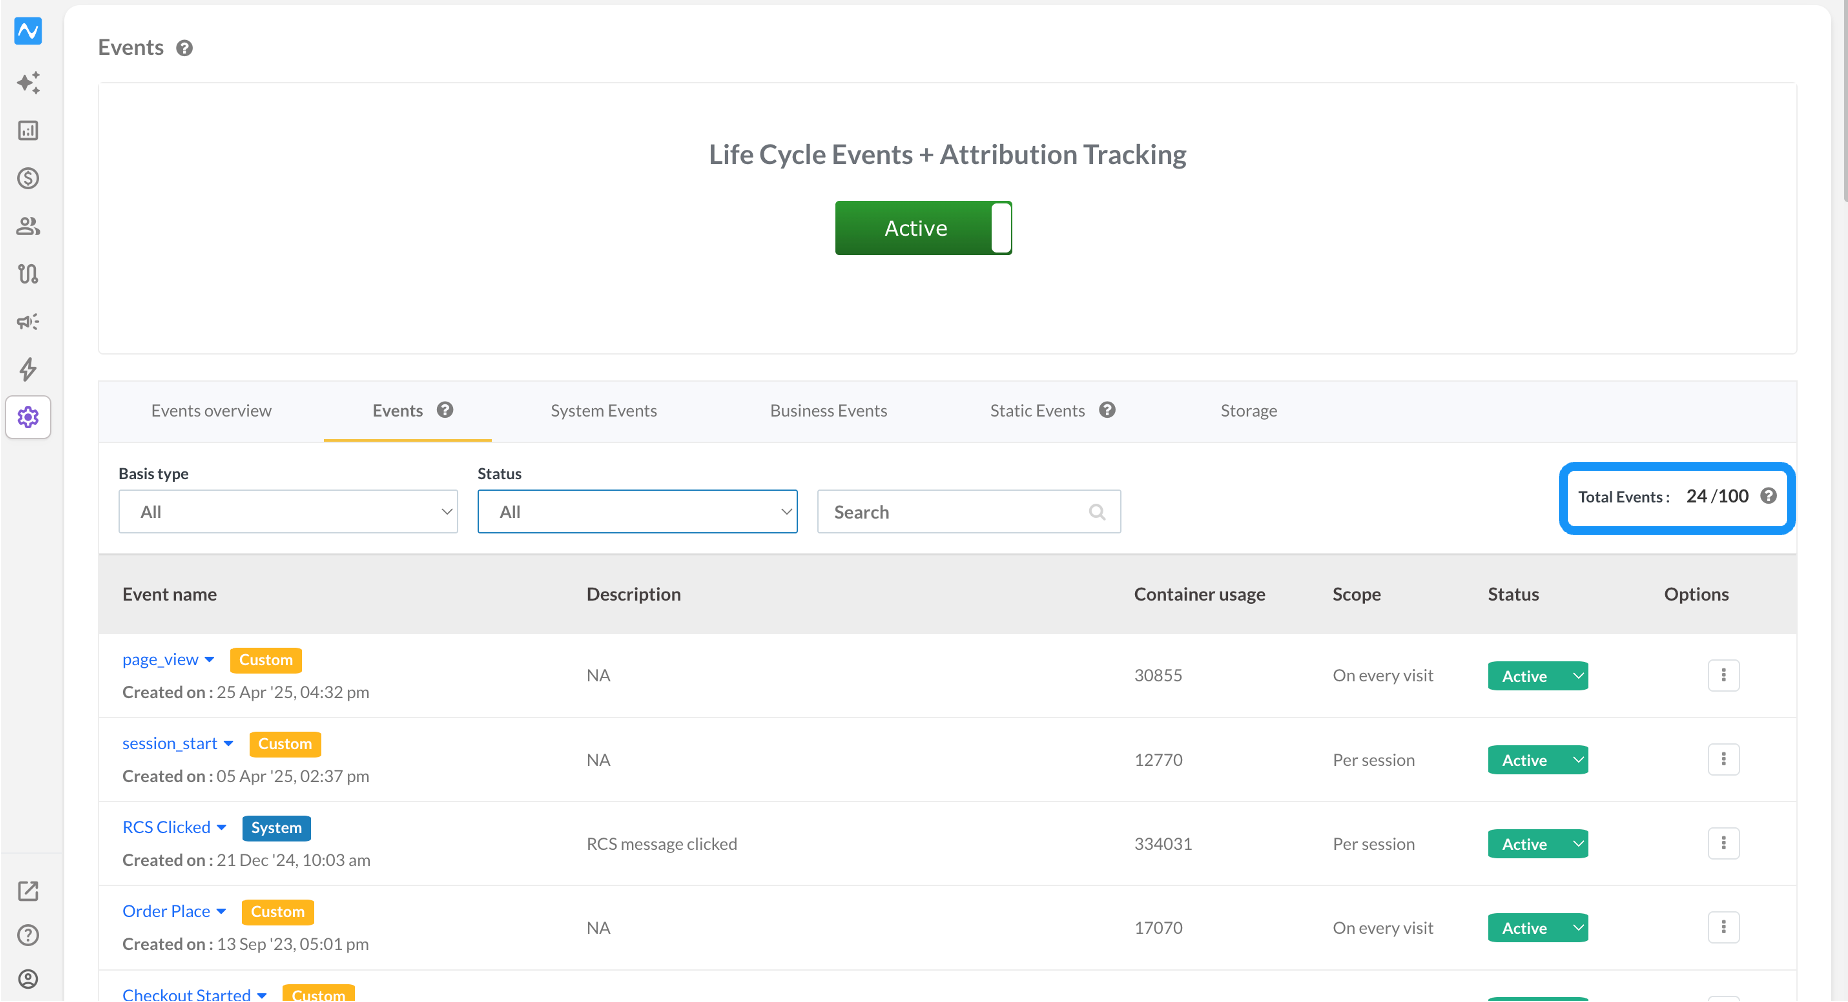
Once the count reaches the limit, new event names are refused while the events already in the list carry on tracking, which is why a brand new event can be the only one missing.
The second is the event volume included in your subscription. Open Organization → Billing → Overview and look at the Events card: it shows a Total Events Limit, and under Events usage, how much of that limit the account has consumed.
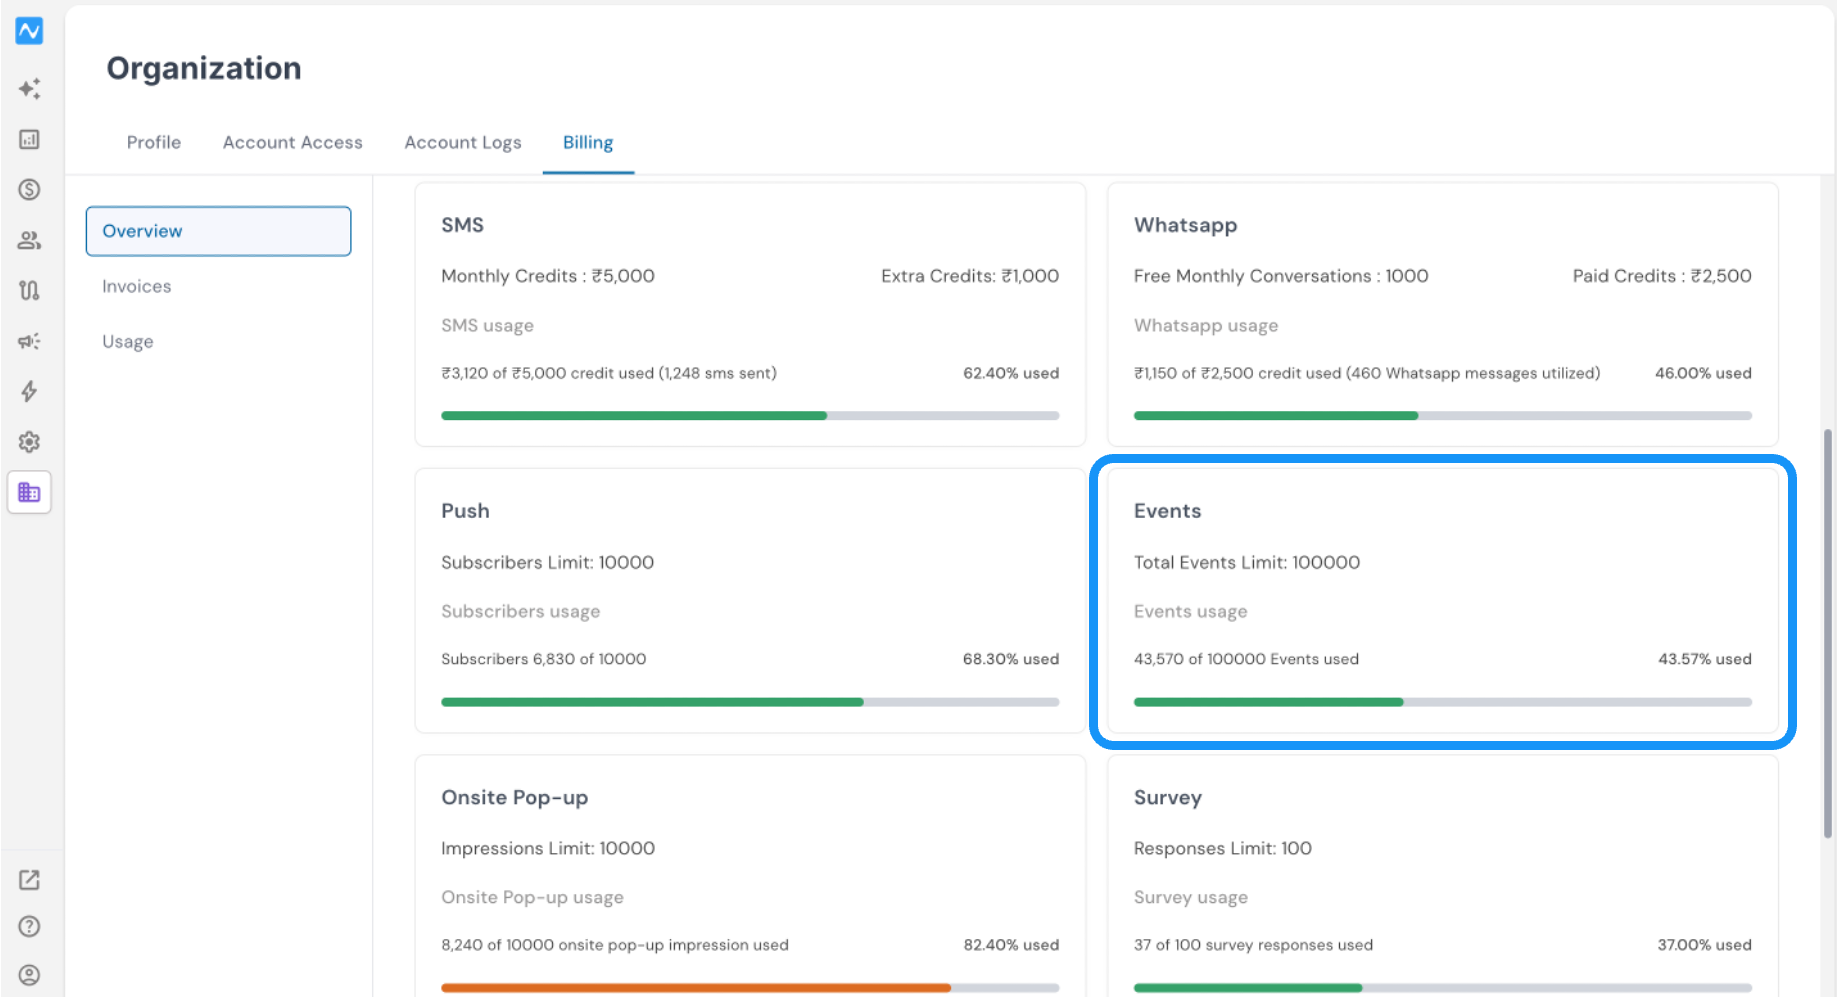
Your plan and the current billing cycle are shown at the top of the same page. If usage has reached 100%, the allowance for the cycle is exhausted, and nothing is wrong with the integration itself.
In either case, retire what you no longer need or ask your account manager to raise the allowance.
How to read the result
| What you see | What it means |
|---|---|
| Switch Active and the event listed as Active | Configuration is fine; move on to the error logs |
| Life Cycle Events + Attribution Tracking switched off | Nothing is being recorded for the project |
| Event present but Status is not Active | The event is being ignored deliberately; re-activate it |
| Event missing from the list | The name has never been received - compare it with the event call |
| Total Events counter at its limit | New event names are being refused |
Part 5 — Check the error logs
If the request is leaving the device and the configuration is correct, the platform is refusing the hit. The error logs are where the reason is recorded.
Where: Settings → Error Logs
Look through the log for the event you are chasing and check for authentication failures, an invalid or malformed payload, attribute validation errors, API or server errors, and rate limiting. Each has a different fix, and this is the only surface that tells you which one you are dealing with.
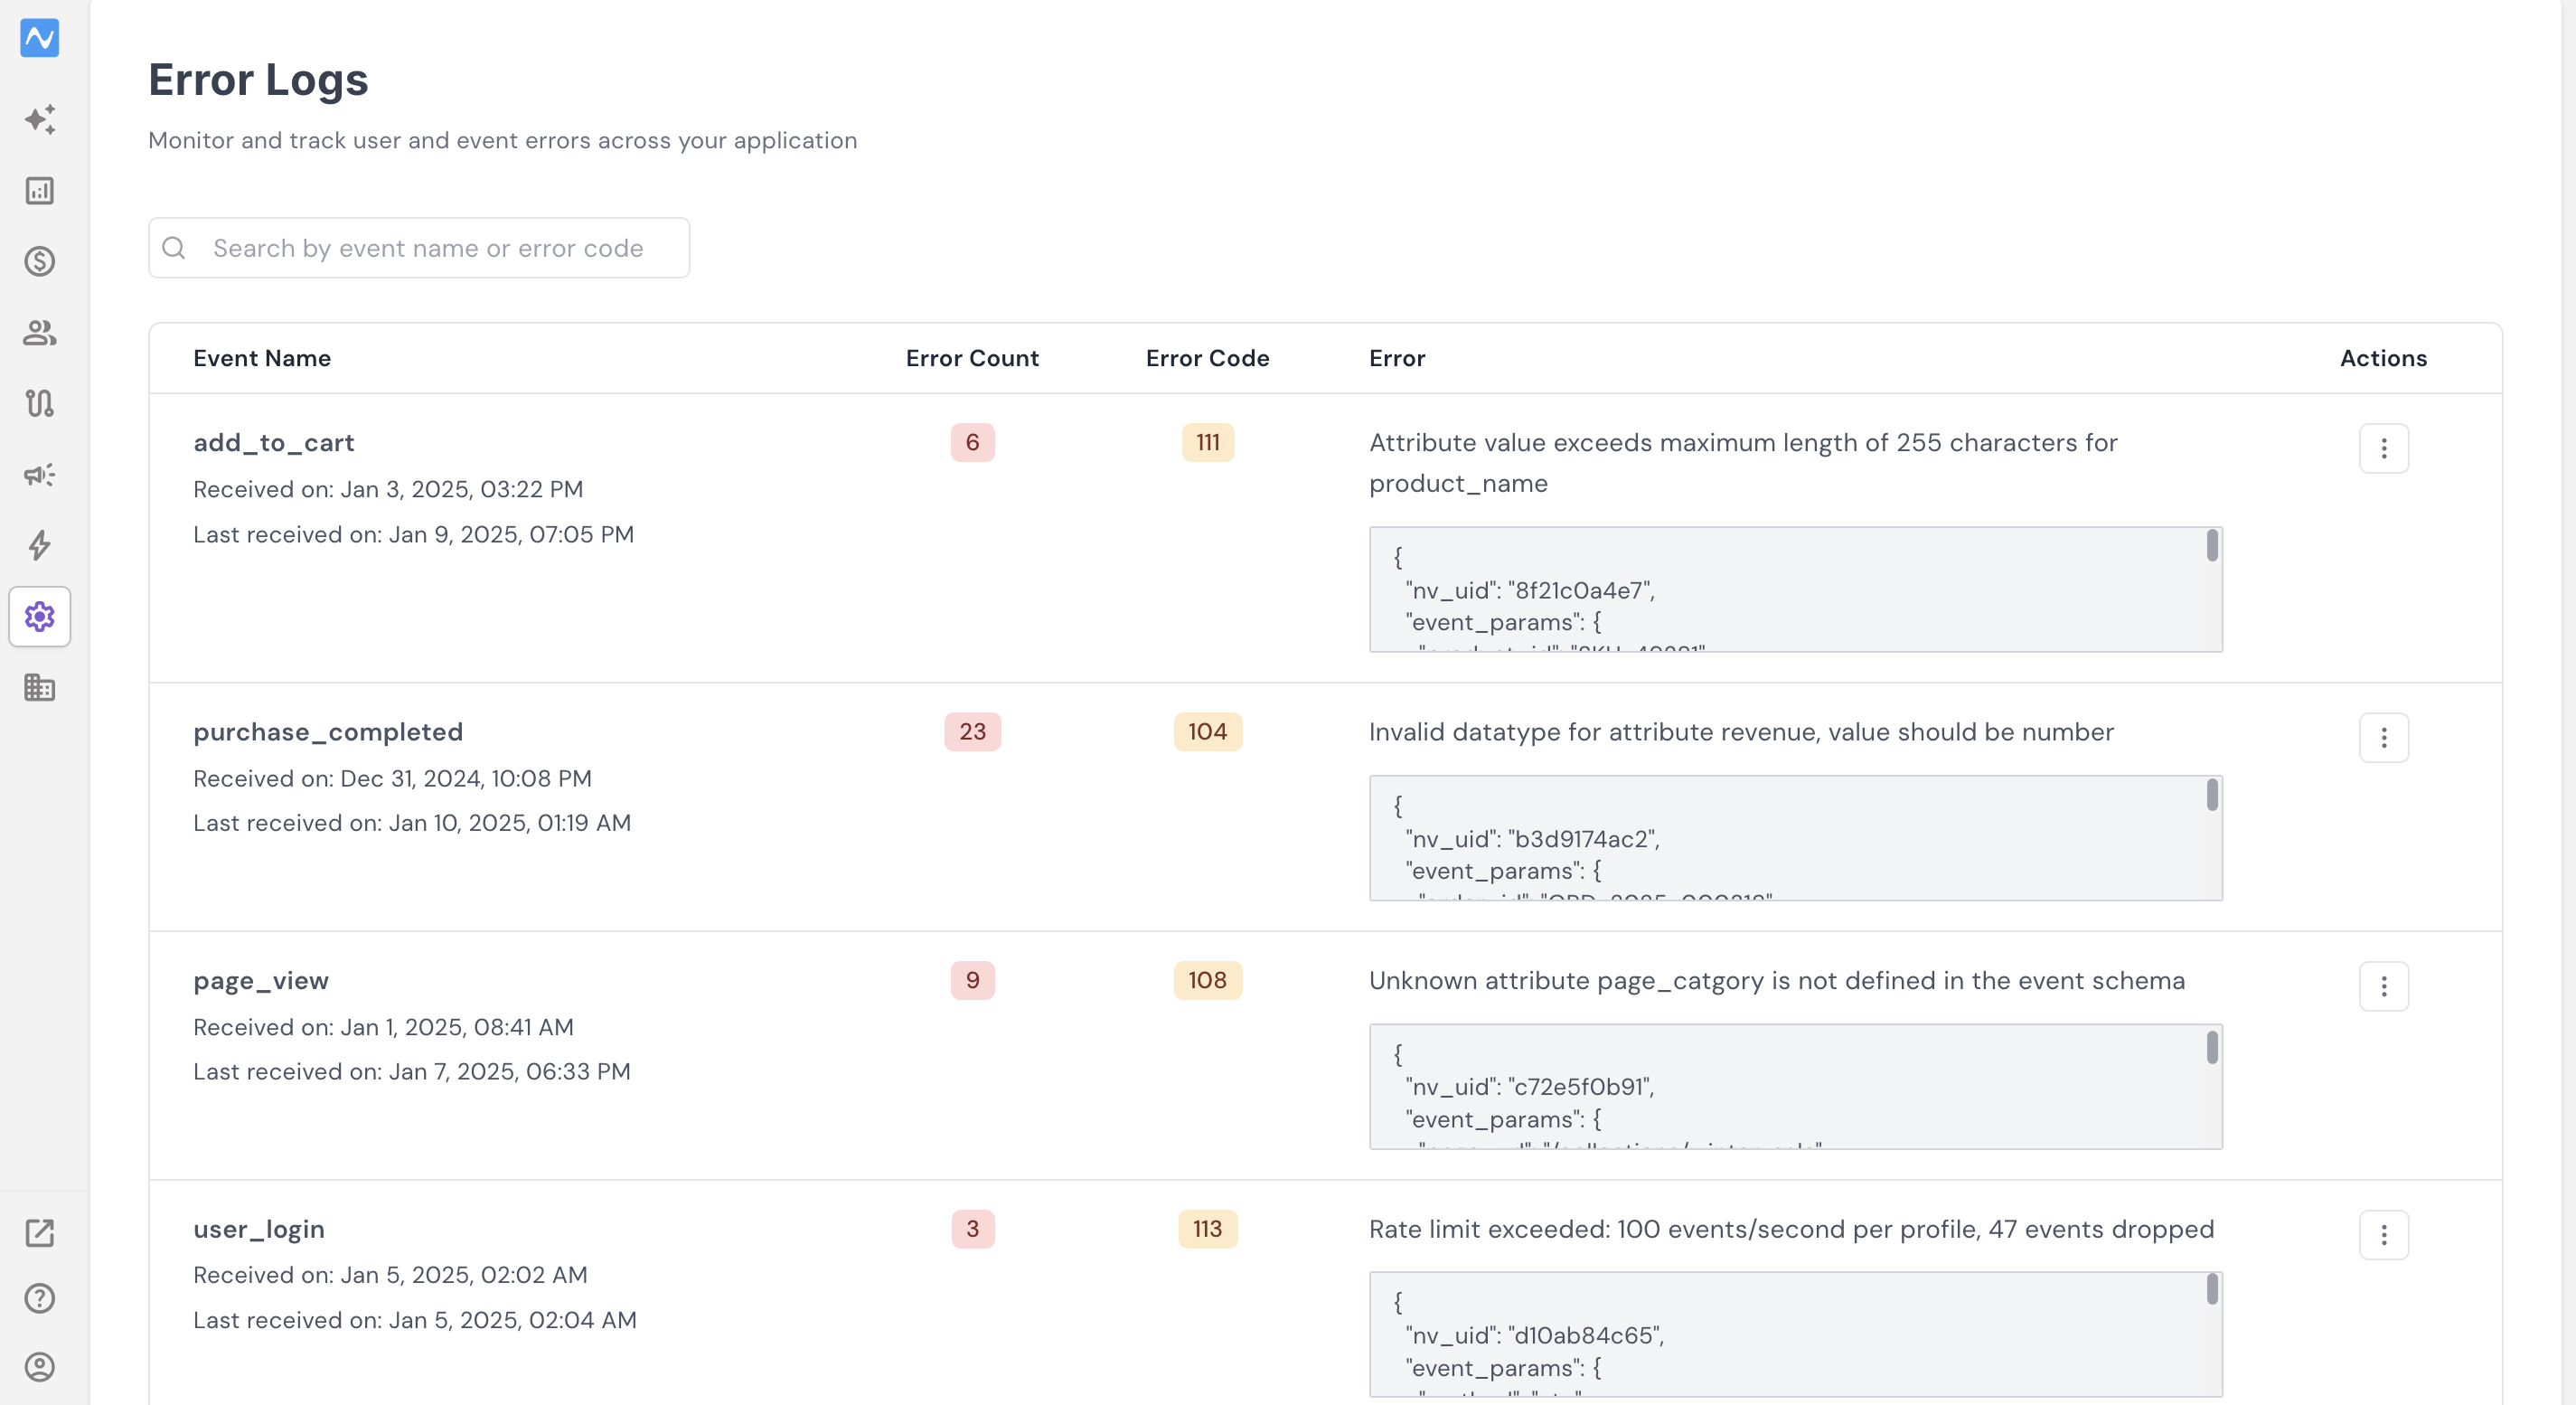
The Android and iOS SDKs report the same class of problem straight back to your code. The callback on the user call returns a status and a message, and those messages map onto what you would otherwise read in the log:
| Callback message | What it means |
|---|---|
| Analytics/Events Status is InActive | Event tracking is switched off for the project - go back to Part 4 |
| SDK not initialized properly. Check for credentials in your application class | Credentials are missing or wrong - go back to Part 1 and Part 2 |
| Authentication failed. | The brand ID and key pair is not valid for this account |
| Required parameter(s) missing (userID or email or mobile) | The call that identifies the user is incomplete, so the event has no profile to attach to |
How to read the result
| What you see | What it means |
|---|---|
| No entries for your event | The platform is not refusing it, so the hit is probably not arriving - go back to Part 3 |
| Payload or validation errors | The event name or an attribute breaks the naming rules, or a value is the wrong type |
| Rate limiting | Requests are arriving faster than the allowance; batch or space out the calls |
Part 6 — Search by nv_uid
The last check answers a different question: not whether the event arrived, but whether it landed on the right person. Read the nv_uid from the SDK, then look that user up in the console.
Where: Segments → User One View
Retrieve the nv_uid
- Website - the SDK stores it in the first-party _nv_uid cookie on your own domain
- Android - NotifyVisitorsApi.getInstance(activityContext).getNvUid()
- iOS - notifyvisitors.getNvUid()
Find the profile and the event
In User One View, search by NV UID and open the profile, then confirm the event appears on that user with the attributes you expect.
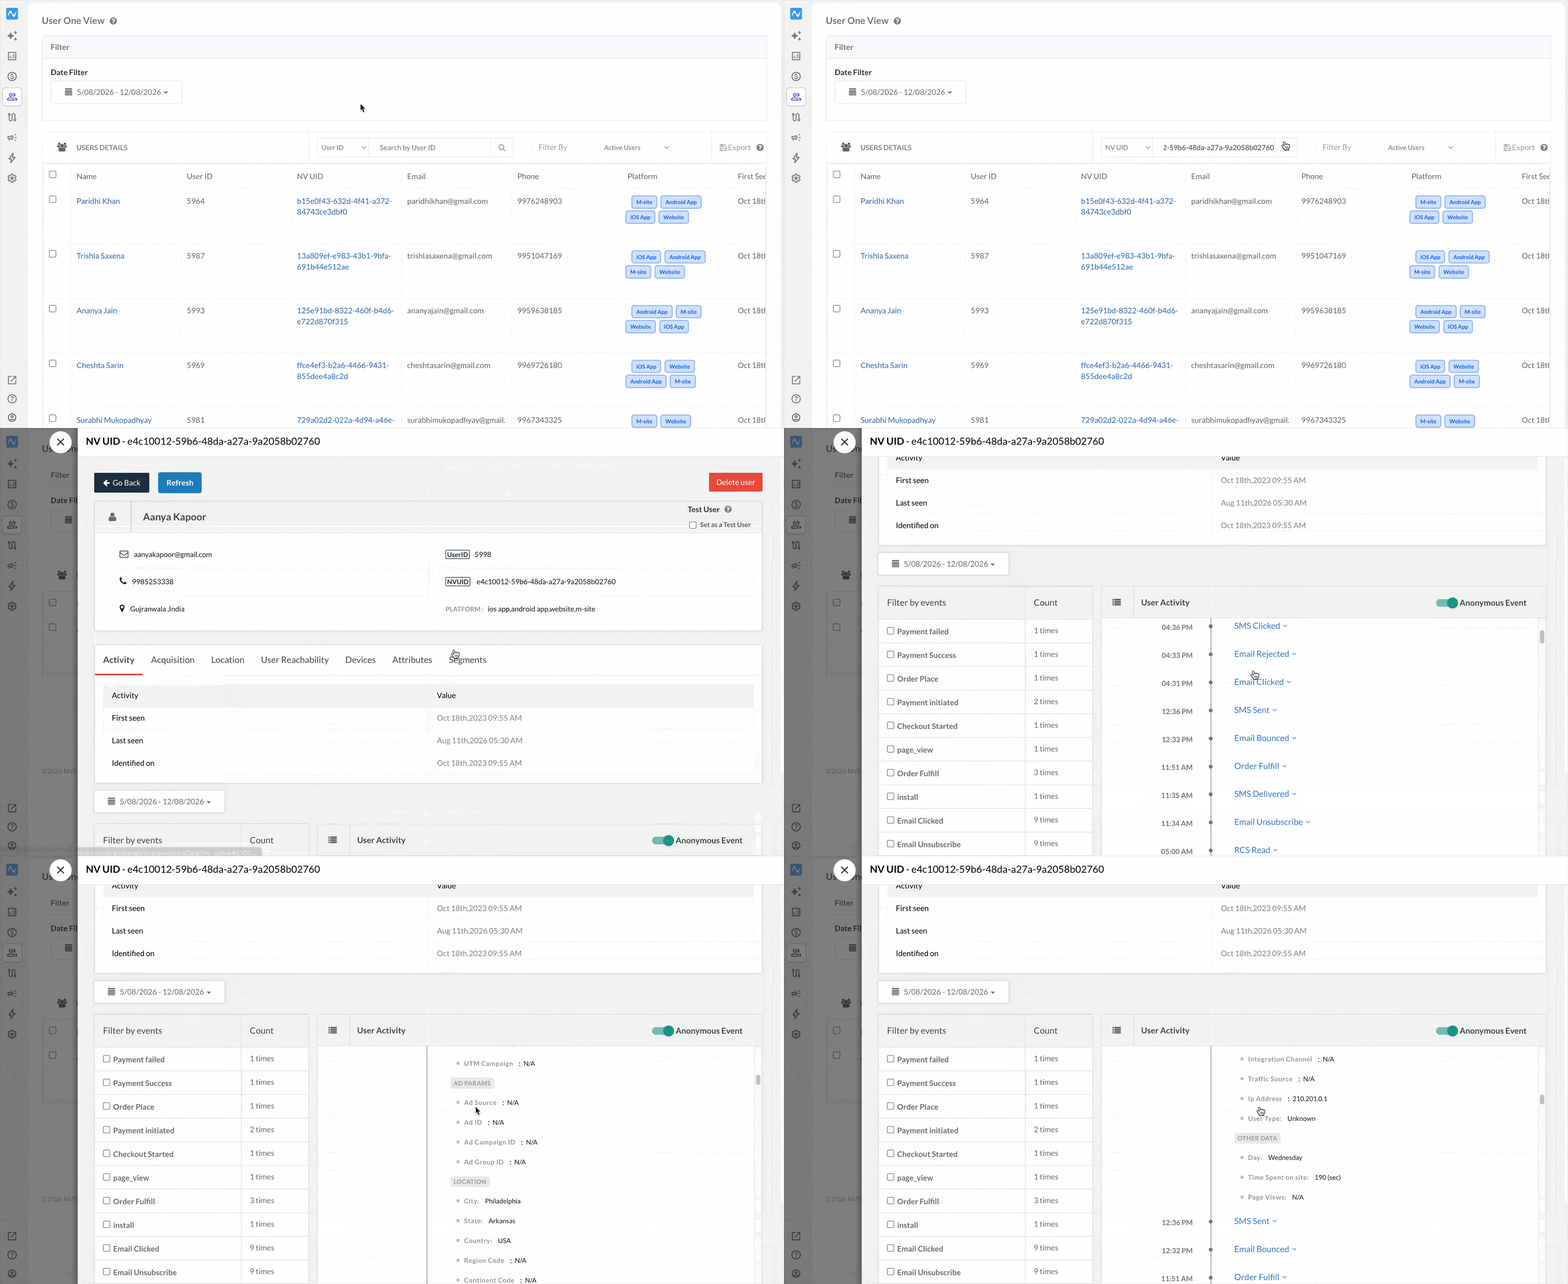
Finding a user and reading the profile in detail - identity, devices, platforms, activity and attributes - is covered in Integration Code, Event, and User Validation.
How to read the result
| What you see | What it means |
|---|---|
| Profile found, and the event is on it | The integration is working end to end |
| Profile found but the event is not on it | The event is arriving without identity attached, or it was refused - re-check Part 4 and Part 5 |
| No profile for that nv_uid | Identity is not reaching NVECTA, so only anonymous traffic is being collected |
Conclusion
These six checks follow an event from the SDK on the device to the profile it belongs on, and each one rules out a layer. Most cases are settled in the first three: the SDK never initialised, the build was pointed at the wrong Brand ID, or the event call never ran. Once the request is confirmed to leave the device and the console configuration is correct, the error logs almost always name the reason.
Run the pass in UAT first, fix what it finds, then repeat it in Production before you build segments or campaigns on the event. If all six checks pass and the event is still missing, raise it with support and include the SDK logs, the event name, the Brand ID, the nv_uid you tested with and the time of the test.
Was this article helpful?
That’s Great!
Thank you for your feedback
Sorry! We couldn't be helpful
Thank you for your feedback
Feedback sent
We appreciate your effort and will try to fix the article