Once you create event models, NVECTA lists them in Insights as Model Event. You can chart them just like the events NVECTA tracks itself: count how often they happen, see how many users performed them, calculate totals and averages from their columns, and break them down by any column in the model.
The data stays in your warehouse. Insights reads it from your event model when you run the report.
If you are new to sources and models, start with Introduction to Composable CDP.
Before you begin
Make sure you have these in place before you chart your warehouse data in Insights:
- An event model: A model with Table Type set to Event Table, a Time Stamp column and your user model as its reference model. See Setting up sources and models.
- Data in your date range: Insights counts only the rows whose Time Stamp column (for example order_time) falls in the date range you pick. If the latest row is older than that range, the chart comes out empty.
The examples in this article use an event model called Order Placed, built on an orders table with one row per order and the columns userid, order_id, order_value, platform, payment_method, status and order_time.
| userid | order_id | order_value | platform | payment_method | status | order_time |
|---|---|---|---|---|---|---|
| U1001 | ORD-50231 | 1499.00 | Android | UPI | completed | 2026-10-28 09:14:22 |
| U1002 | ORD-50232 | 899.00 | Web | Card | completed | 2026-10-28 10:02:51 |
| U1001 | ORD-50233 | 2350.00 | Android | Wallet | cancelled | 2026-10-28 18:40:05 |
| U1003 | ORD-50234 | 499.00 | iOS | COD | completed | 2026-10-29 11:27:36 |
Step 1: Choose your model event
Where: Analytics > Insights
- Under Events, click Select Event.
- In the list on the left, select Model Event. Every event model you created appears under Model Events, by its model name.
- Select your event model, for example Order Placed. You can also type its name in Search Events.
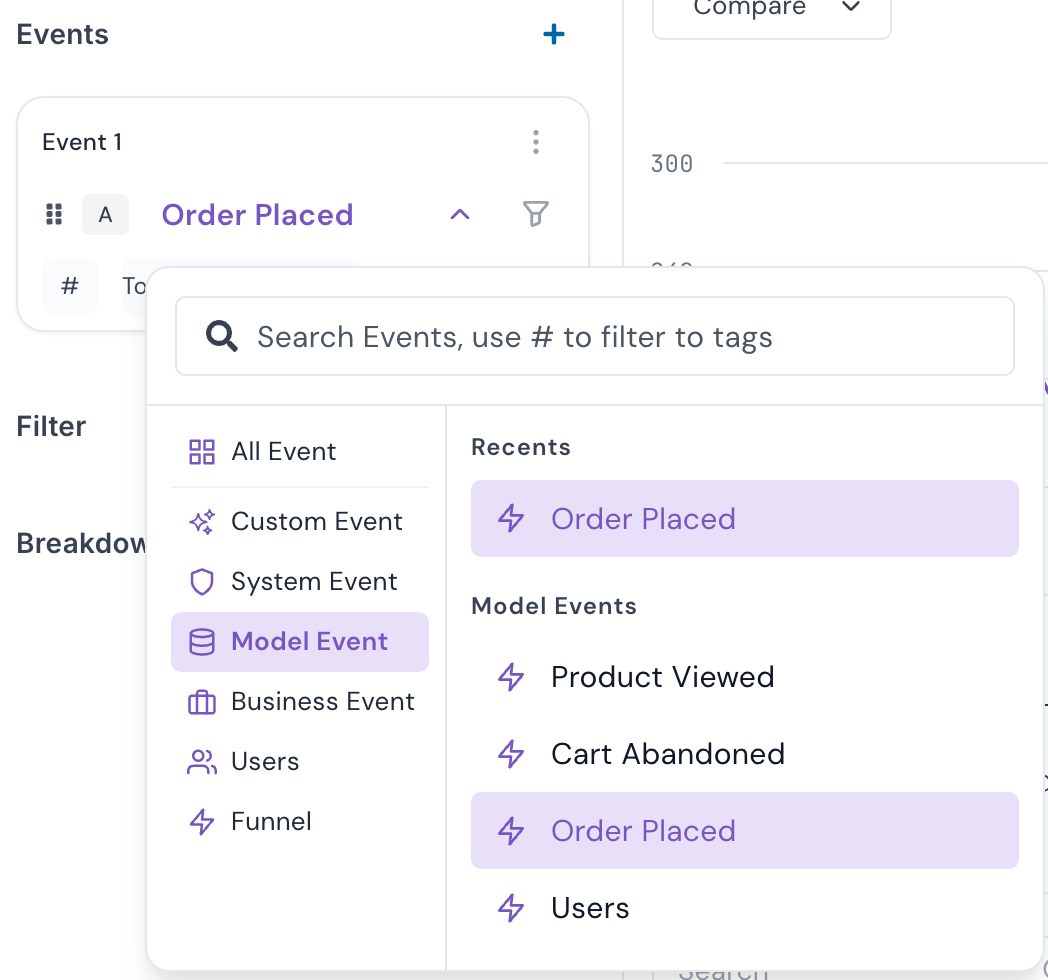
The list shows every model on your sources, including user models, so pick a model whose Table Type is Event Table.
Step 2: Choose what to measure
Below the event, click the measure, which starts as Total Events, and choose one:
- Total Events: The number of rows in the event model, for example how many orders were placed.
- Unique Users: The number of different users who performed the event.
- Aggregate by: A calculation on a number column of the model: Sum of property, Average of property, Min of property, Max of property, Median of property, Percentiles or Distinct count. For example, use Sum of property on an order_value column to chart revenue.
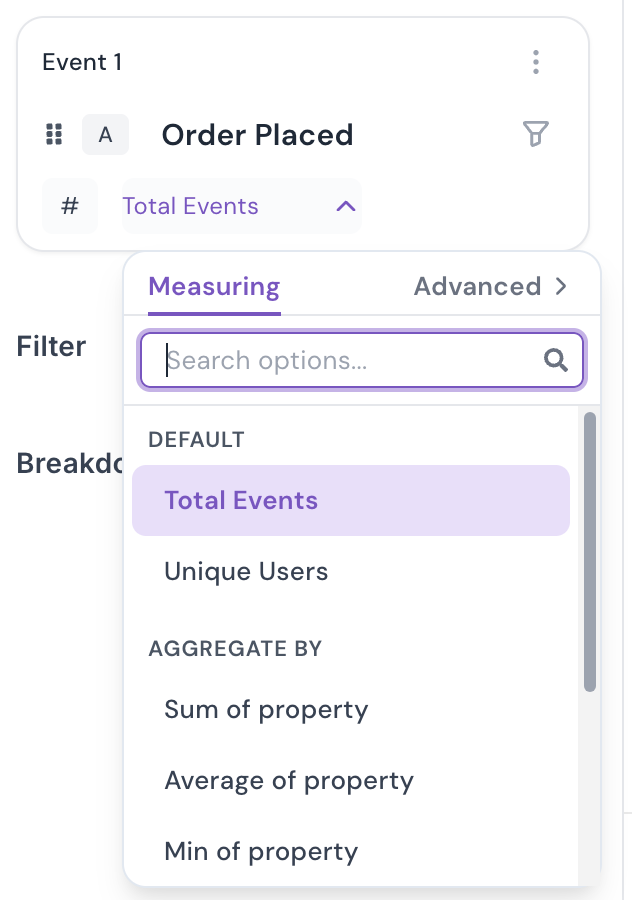
Under Advanced, you can show the result as a Rolling Average or a Cumulative Sum.
Step 3: Filter and break down by model columns
The columns of your event model are listed as Model Attribute, so you can slice the chart by any of them.
- Filter one event: Click the filter icon next to the event, choose an Attribute, a Condition and a Value, then click Apply Filter. For example, count only rows where status is completed.
- Filter the whole report: Click + next to Filter. Choose a column under Model Attribute, or select Segment to chart only the users in a segment, such as a Query Based Segment.
- Break down: Click + next to Breakdown, select Model Attribute and choose a column. For example, break down by payment_method to see one line per payment method, or by platform to compare Android and iOS.
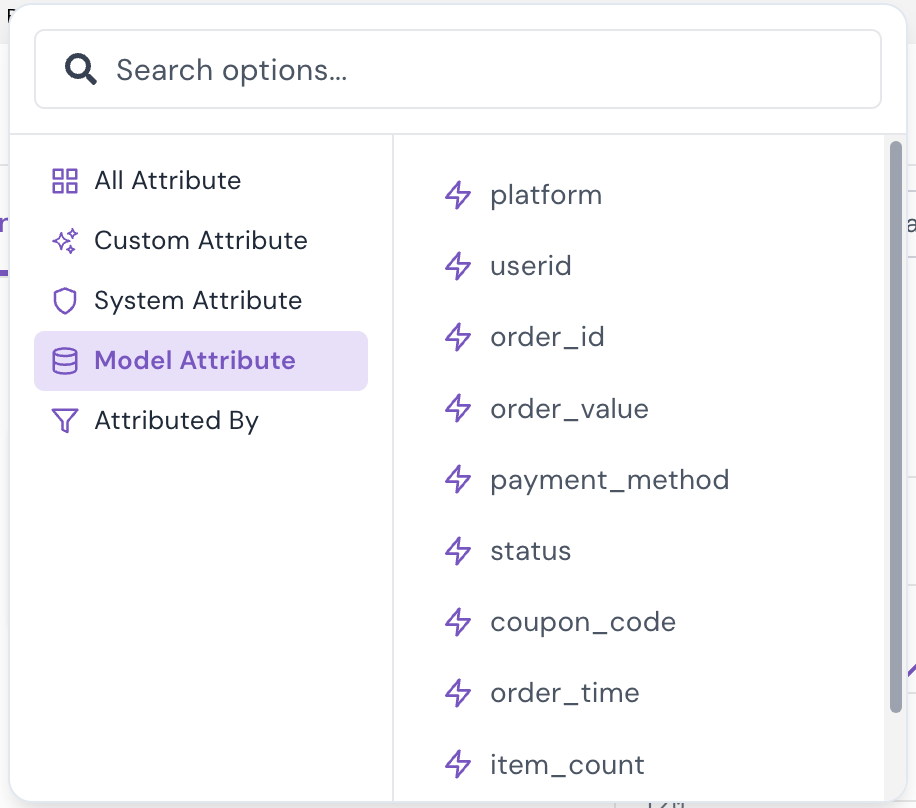
Model Attribute lists the columns of the event model itself. Columns that are only in your user model, such as city, are not listed. To slice a model event by a user column, build the event model with SQL Query and join your user table, so that the column is part of the event model.
Step 4: Run and read the report
- Click Apply at the bottom of the left panel.
- Pick a date range at the top, such as 7D, 30D or 12M, or set your own with Custom.
- Choose how to group the chart, for example Daily, and the chart type, for example Line.
The chart shows your model event over time, and the table below it shows the value for each day along with the Avg for the period.
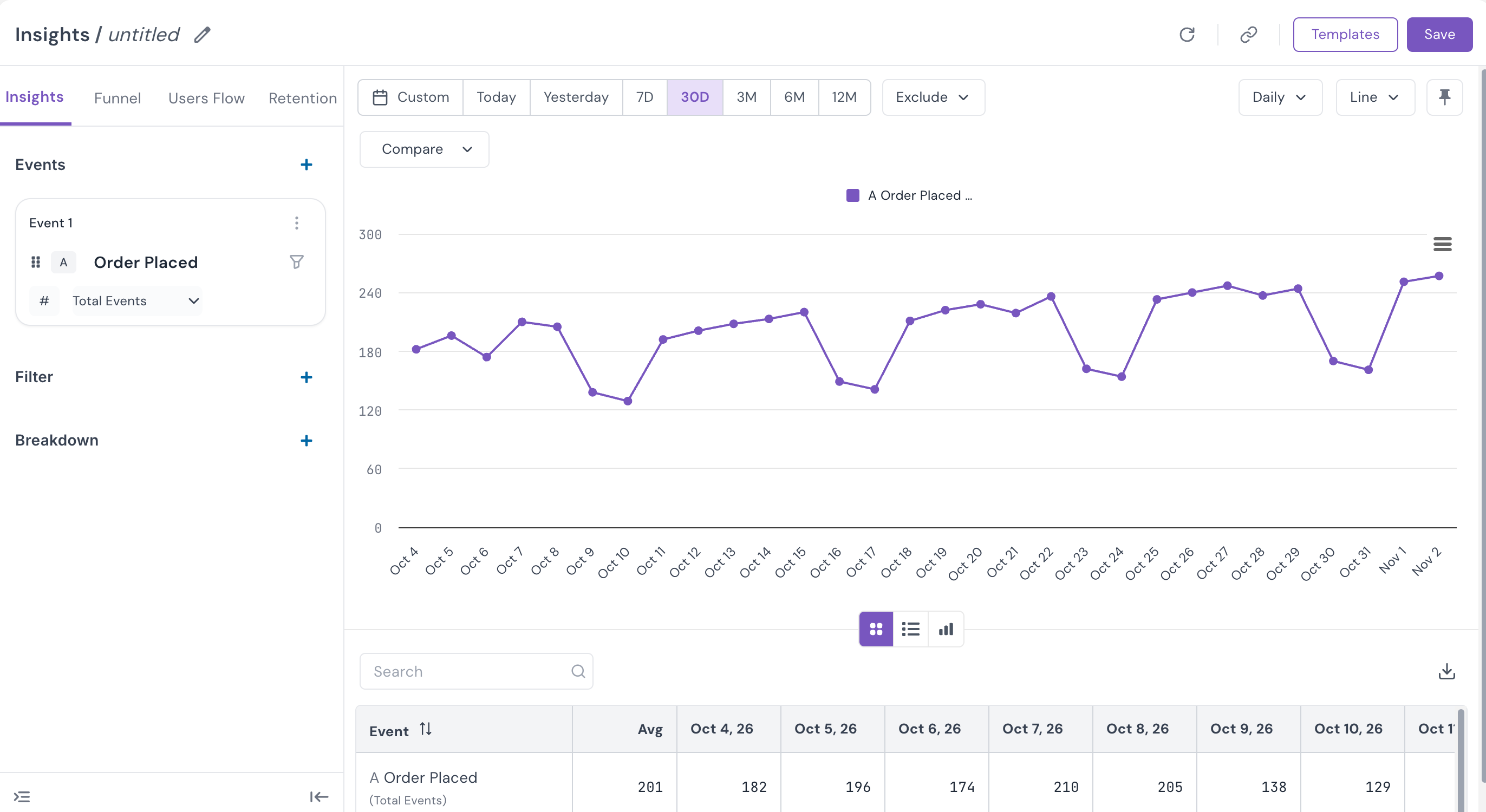
Click Save to keep the report. Use Compare to compare the period with an earlier one.
Combine model events with other events
A model event works like any other event in Insights. Click + next to Events to add more events to the same chart, for example Order Placed next to an email or push event that NVECTA tracks, to see whether a campaign drove more orders.
Model events are also available in the other report types at the top of the builder: Funnel, Users Flow and Retention. The event lists in this show model events together with your custom events, so search for the model by name.
Example: daily orders by platform
To see how many orders were placed each day in the last 30 days, split by platform:
- In Analytics > Insights, select Model Event and choose Order Placed.
- Keep the measure as Total Events.
- Click the filter icon next to the event and set status, Include, completed.
- Under Breakdown, select Model Attribute and choose platform.
- Click Apply, then select 30D and Daily.
To count customers instead of orders, change the measure to Unique Users. To chart revenue instead, choose Sum of property on order_value.
Troubleshooting
| Problem | Likely cause | What to do |
|---|---|---|
| The chart shows "No data found for this period" | The table has no rows with a Time Stamp in the date range. | Pick a longer range, such as 12M, and check that new rows are reaching the table. |
| Your model is missing from Model Event | The model was not saved. | Check that the model is listed in Settings > Data Connector > Models. |
| A column is missing from Model Attribute | The column was turned off, or it is only in the user model. | Edit the model and turn the column on in the Mapping step. |
| Sum of property or Average of property shows wrong values | The column is not stored as a number. | Set its Data Type to integer in the model's Mapping step, or cast it in a SQL Query model. |
What's next
Target the users behind these events with a Query Based Segment. See Creating Query Based Segments.
Was this article helpful?
That’s Great!
Thank you for your feedback
Sorry! We couldn't be helpful
Thank you for your feedback
Feedback sent
We appreciate your effort and will try to fix the article